

Question: The accompanying normal quantile plot was constructed from the diastolic blood pressure levels of a sample of women. What does this graph suggest about diastolic
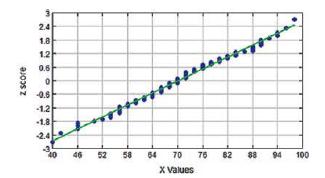
The accompanying normal quantile plot was constructed from the diastolic blood pressure levels of a sample of women. What does this graph suggest about diastolic blood pressure levels of women?
In assume that scores on a bone mineral density test are normally distributed with a mean of 0 and a standard deviation of 1.
z score Wali 2.4 1.8 1.2 260 0.6 o -0.5 -1.2 -1.8 24-9 40 46 52 58 64 70 X Values 76 82 88 94 100
Step by Step Solution
★★★★★
3.44 Rating (173 Votes )
There are 3 Steps involved in it
1 Expert Approved Answer
Step: 1 Unlock

The normal quantile ... View full answer
Question Has Been Solved by an Expert!
Get step-by-step solutions from verified subject matter experts
Step: 2 Unlock
Step: 3 Unlock