

Question: The previous exercise describes a study conducted by Busseri and colleagues (2009) using a group of pessimists. These researchers asked the same question of a
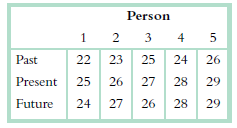
The previous exercise describes a study conducted by Busseri and colleagues (2009) using a group of pessimists. These researchers asked the same question of a group of optimists: Optimists rated their past, present, and projected future satisfaction with their lives. Higher scores on the life-satisfaction measure indicate higher satisfaction. The data below reproduce the pattern of means that the researchers observed in self-reported life satisfaction of the sample of optimists for the three time points. Do optimists see a rosy future ahead?
a. Perform steps 5 and 6 of hypothesis testing. Be sure to complete the source table when calculating the F ratio for step 5.
b. If appropriate, calculate the Tukey HSD for all possible mean comparisons. Find the critical value of q and make a decision regarding the null hypothesis for each of the mean comparisons.
c. Calculate the R2 measure of effect size for this ANOVA.
Person 1 2 3 4 Past 22 23 25 24 26 Present 25 26 27 28 29 Future 24 27 26 28 29
Step by Step Solution
3.38 Rating (160 Votes )
There are 3 Steps involved in it
a Step 5 We must first calculate df and SS to fill in the source table df between N groups 1 2 df su... View full answer

Get step-by-step solutions from verified subject matter experts
Document Format (2 attachments)
1421_60547789db837_675418.pdf
180 KBs PDF File
1421_60547789db837_675418.docx
120 KBs Word File