

Question: Use the frequency distribution from Exercise 11 in Section 2-1 on page 49 to construct a frequency polygon. Does the graph suggest that the distribution
Use the frequency distribution from Exercise 11 in Section 2-1 on page 49 to construct a frequency polygon. Does the graph suggest that the distribution is skewed? If so, how?
In construct the frequency polygons.
Data From Section 2.1 Exercise 11
Listed below are sorted duration times (seconds) of eruptions of the Old Faithful geyser in Yellowstone National Park. Use these times to construct a frequency distribution. Use a class width of 25 seconds and begin with a lower class limit of 125 seconds.
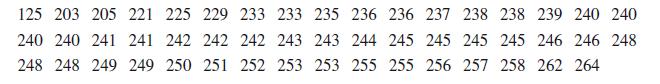
125 203 205 221 225 229 233 233 235 236 236 237 238 238 239 240 240 245 245 246 246 248 240 240 241 241 242 242 242 243 243 244 245 245 248 248 249 249 250 251 252 253 253 255 255 256 257 258 262 264
Step by Step Solution
3.34 Rating (160 Votes )
There are 3 Steps involved in it
The distribution appears to be skewed to the lef... View full answer

Get step-by-step solutions from verified subject matter experts