

Question: Use the frequency distribution from Exercise 18 in Section 2-1 on page 49 to construct a histogram. What can be concluded from the distribution of
Use the frequency distribution from Exercise 18 in Section 2-1 on page 49 to construct a histogram. What can be concluded from the distribution of the digits? Specifically, do the heights appear to be reported or actually measured?
In construct the histograms and answer the given questions.
Data From Section 2.1 Exercise 18
Weights of respondents were recorded as part of the California Health Interview Survey. The last digits of weights from 50 randomly selected respondents are listed below. Construct a frequency distribution with 10 classes. Based on the distribution, do the weights appear to be reported or actually measured? What do you know about the accuracy of the results?
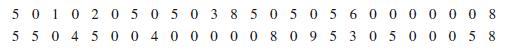
501 02 05 050 38 50 50 56 0000008 55045004000008095 30500058
Step by Step Solution
3.48 Rating (158 Votes )
There are 3 Steps involved in it
The digits 0 and 5 appear to occur mor... View full answer

Get step-by-step solutions from verified subject matter experts