

Question: Use the same data from Exercise 6 and use the same scale to construct a boxplot of the braking reaction times of males and another
Use the same data from Exercise 6 and use the same scale to construct a boxplot of the braking reaction times of males and another boxplot for the braking reaction times of females. What do the boxplots suggest?
Data From Exercise 6
Listed below are sorted braking reaction times (in 1/10,000 sec) for male and female subjects (based on data from the RT-2S Brake Reaction Time Tester). Construct a histogram for the reaction times of males. Use a class width of 8 and use 28 as the lower limit of the first class. For the horizontal axis, use class midpoint values. Does it appear that the data are from a population with a normal distribution?
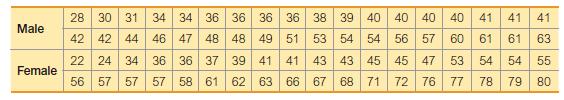
Male Female 28 30 31 34 34 36 36 36 36 38 39 40 40 40 42 42 44 46 47 48 48 49 51 53 54 54 56 57 39 41 41 43 43 45 45 47 62 63 66 67 68 71 72 76 22 24 34 36 36 37 56 57 57 57 58 61 40 41 60 53 77 41 41 61 61 54 78 79 1 63 55 80 54
Step by Step Solution
3.39 Rating (168 Votes )
There are 3 Steps involved in it
Males 20 24 28 32 36 40 44 48 52 56 Females 24 28 32 36 40 44 4... View full answer

Get step-by-step solutions from verified subject matter experts