

Question: Use the sample data from Exercise 6 with a 0.01 significance level to test the claim that males and females have the same mean. Data
Use the sample data from Exercise 6 with a 0.01 significance level to test the claim that males and females have the same mean.
Data from in Exercise 6
Listed below are sorted braking reaction times (in 1>10,000 sec) for male and female subjects (based on data from the RT-2S Brake Reaction Time Tester). Construct a histogram for the reaction times of males. Use a class width of 8 and use 28 as the lower limit of the first class. For the horizontal axis, use class midpoint values. Does it appear that the data are from a population with a normal distribution?
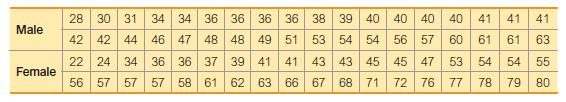
Male Female 28 42-22 56 30 31 34 34 36 36 36 36 38 39 40 40 40 54 54 56 42 44 46 47 48 48 49 51 53 24 34 36 36 37 39 41 41 43 43 45 57 57 58 61 62 63 66 67 68 71 72 57 40 41 41 41 57 60 61 61 54 76 77 78 79 45 47 53 7888 63 54 55 80
Step by Step Solution
3.37 Rating (156 Votes )
There are 3 Steps involved in it
Here is a histogram for the reaction times of male subjects ba... View full answer

Get step-by-step solutions from verified subject matter experts