Use these data to answer Questions 2a and 2b. a. Using either a calculator or Excel, compute
Question:
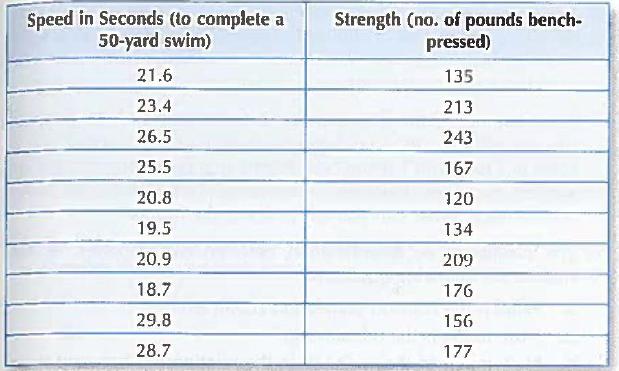
Use these data to answer Questions 2a and 2b.
a. Using either a calculator or Excel, compute the Pearson correlation coefficient.

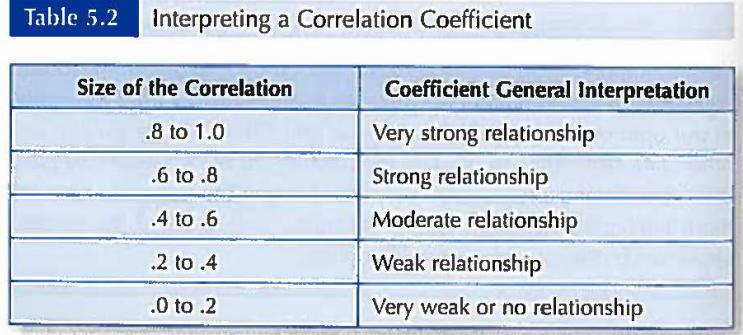
b. Interpret the relationship between these variables using the descriptions in Table 5.2 ranging from "very weak" to "very strong." Then compute the coefficient of determination. How does your subjective analysis compare with the value of the r you calculated?
Data From Question 2a

Data From Question 2b

Data From Table 5.2

Fantastic news! We've Found the answer you've been seeking!
Step by Step Answer:
Related Book For 

Question Posted:


