

Question: Using the following data: a. Create a scatterplot. b. Calculate deviation scores and products of the deviations for each individual, and then sum all products.
a. Create a scatterplot.
b. Calculate deviation scores and products of the deviations for each individual, and then sum all products. This is the numerator of the correlation coefficient equation.
c. Calculate the sum of squares for each variable. Then compute the square root of the product of the sums of squares. This is the denominator of the correlation coefficient equation.
d. Divide the numerator by the denominator to compute the coefficient, r.
e. Calculate degrees of freedom.
f. Determine the critical values, or cutoffs, assuming a two-tailed test with a p level of 0.05.
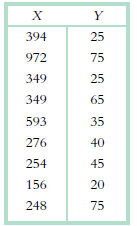
394 25 972 75 349 25 349 65 593 35 276 40 254 45 156 20 248 75
Step by Step Solution
3.44 Rating (170 Votes )
There are 3 Steps involved in it
a b c d e df r N 2 9 ... View full answer

Get step-by-step solutions from verified subject matter experts
Document Format (2 attachments)
1421_60547789d9625_662978.pdf
180 KBs PDF File
1421_60547789d9625_662978.docx
120 KBs Word File