

Question: Analyze creditspreads as in Table 5.5. Data given in table 5.5 Table 5.5 Gain expectation for credit spreads So = $80, r= 1%, T =
Analyze creditspreads as in Table 5.5.
Data given in table 5.5
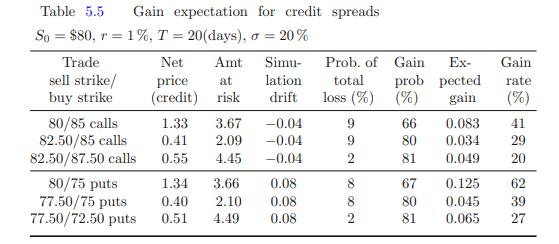
Table 5.5 Gain expectation for credit spreads So = $80, r= 1%, T = 20(days), o= 20% Trade sell strike/ buy strike 80/85 calls 82.50/85 calls 82.50/87.50 calls 80/75 puts 77.50/75 puts 77.50/72.50 puts Net price at (credit) risk 1.33 0.41 0.55 Amt Simu- lation drift 1.34 0.40 0.51 3.67 -0.04 2.09 -0.04 4.45 -0.04 3.66 0.08 2.10 0.08 4.49 0.08 Prob. of Gain Ex- prob total pected loss (%) (%) gain 9 9 2 8 N 8 2 66 80 81 0.083 0.034 0.049 Gain rate (%) 41 29 20 67 0.125 62 80 0.045 39 81 0.065 27
Step by Step Solution
3.42 Rating (161 Votes )
There are 3 Steps involved in it
The table shows the expected gain or loss for various credit spread trades Lets analyze two call spread trades and two put spread trades Call spread t... View full answer

Get step-by-step solutions from verified subject matter experts