J K Cements Limited is a leading manufacturer of cement in India with installed grey cement capacity
Question:
J K Cements Limited is a leading manufacturer of cement in India with installed grey cement capacity of 10.5 million tonne per annum. It is the second largest manufacturer of white cement with an annual capacity of 600,000 tonnes and is also the second largest manufacture of wall putty with an annual installed capacity of 700,000 tonnes. The company has captive power generation capacity of over 140 MWs including 23 MW of waste heat recovery power plant. The company’s growth is backed by access to best quality raw material and highly skilled manpower.
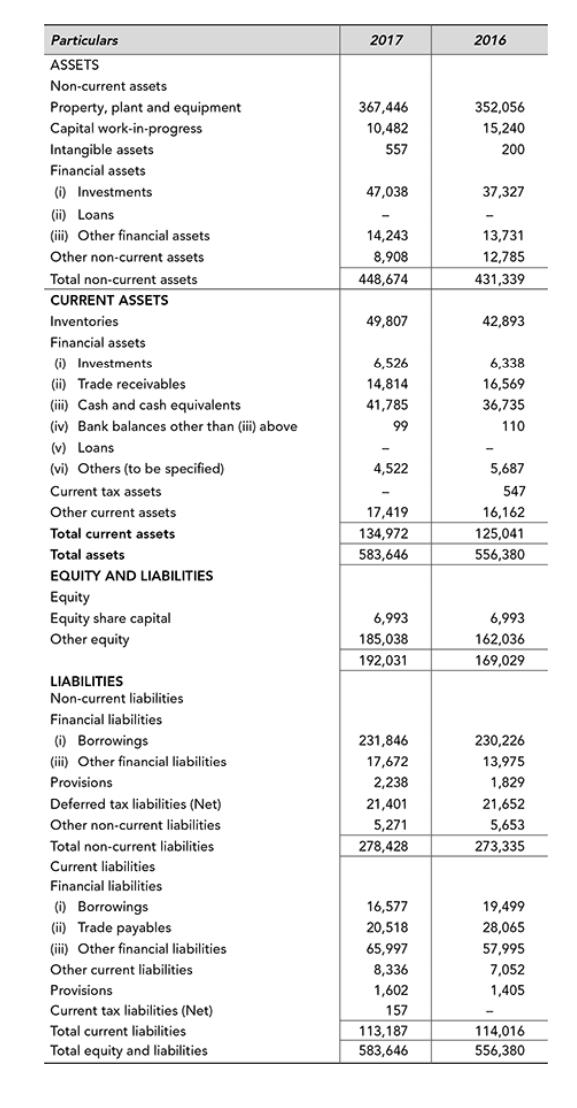
The financial statements of the company for the year 2015–16 and 2016–17 are given below:
1. Balance Sheet as on 31st March
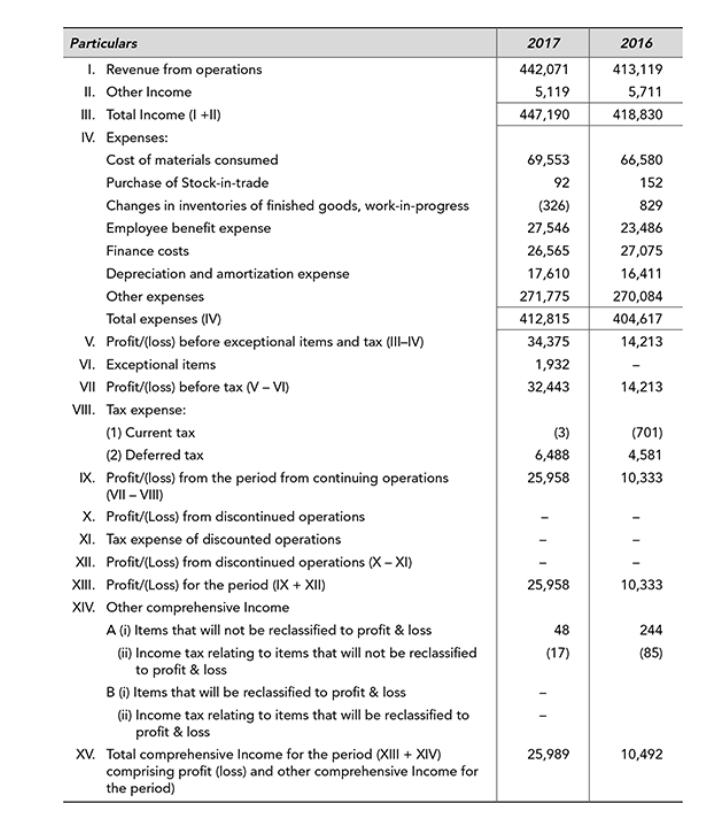
2. Statement of Profit & Loss for the Year Ended 31st March
Questions for Discussion
1. The profit of the company has more than doubled in 2016–17. Identify the 10 reasons with the help of suitable ratios.
2. Though the profit has increased during 2016–17, the company has maintained the dividend at the same level. What is the impact on the dividend payout ratio?
3. The company has significant amount in deferred tax liability. What are probable reasons for the same?
4. Calculate the debt equity ratio and interest coverage ratio, and comment upon the capital structure of the company.
5. Comment upon the liquidity position of the company with the help of appropriate ratios.
6. Trade payable and trade receivables have declined whereas inventories have increased in 2016–17 as compared to the previous year. Compute receivable turnover ratio, inventory turnover ratio, average collection period, average holding period, average payment period, and cash cycle of the company. Has working capital efficiency improved?
7. Analyse the year-on-year growth of income and profit.
8. Calculate the return on equity for the company for the last two years and analyze the same using DuPont analysis.
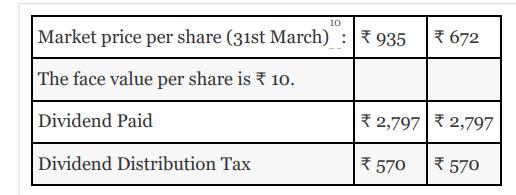
9. Using the above information, determine earnings per share, market capitalization, market value to book value ratio, dividend yield and price-earnings ratio.
Step by Step Answer: