

Key figures for Apple and Google follow. Required 1. Compute the debt-to-equity ratios for Apple and Google
Question:
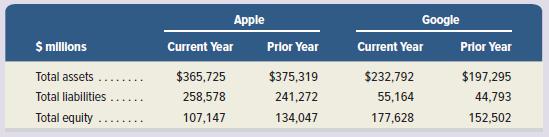
Key figures for Apple and Google follow.
Required
1. Compute the debt-to-equity ratios for Apple and Google for both the current year and the prior year.
2. Use the ratios from part 1 to determine which company’s financing structure is less risky.
3. Is its debt-to-equity ratio more risky or less risky compared to the industry (assumed) average of 0.5 for
(a) Apple
(b) Google?
Fantastic news! We've Found the answer you've been seeking!
Step by Step Answer:
ANSWER 1 Compute the debttoequity ratios for Apple and ...View the full answer

Answered By
Aketch Cindy Sunday
I am a certified tutor with over two years of experience tutoring . I have a passion for helping students learn and grow, and I firmly believe that every student has the potential to be successful. I have a wide range of experience working with students of all ages and abilities, and I am confident that I can help students succeed in school.
I have experience working with students who have a wide range of abilities. I have also worked with gifted and talented students, and I am familiar with a variety of enrichment and acceleration strategies.
I am a patient and supportive tutor who is dedicated to helping my students reach their full potential. Thank you for your time and consideration.
0 Reviews
10+ Question Solved
Related Book For 

Financial Accounting Information For Decisions
ISBN: 9781260705584
10th Edition
Authors: John J. Wild
Question Posted:
