

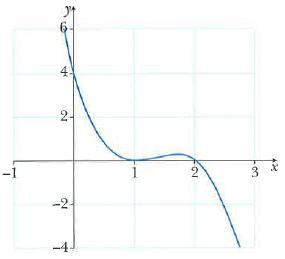
The diagram shows the graph of y = k(x a) 2 (x b). Find the
Question:
The diagram shows the graph of y = k(x – a)2 (x – b).
Find the values of a, b and k.
Fantastic news! We've Found the answer you've been seeking!
Step by Step Answer:
To find the values of a b and k we can use the given points A0 4 B1 0 and C2 0 that lie on the graph of the equation y kx a2 x b Lets plug in the coor...View the full answer

Answered By
Saleem Abbas
Have worked in academic writing for an a years as my part-time job.
1+ Reviews
10+ Question Solved
Related Book For 
Cambridge IGCSE And O Level Additional Mathematics Coursebook
ISBN: 9781108411660
2nd Edition
Authors: Sue Pemberton
Question Posted:
