

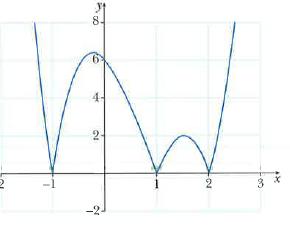
The diagram shows the graph of y = |k(x a) (x b) (x c)|
Question:
The diagram shows the graph of y = |k(x – a) (x – b) (x – c)| where a < b < c.
Find the values of a, b, c and k.
Fantastic news! We've Found the answer you've been seeking!
Step by Step Answer:
To find the values of a b c and k in the equation y kx ax bx c we need to analyze the graph and use ...View the full answer

Answered By
Deepak Sharma
0 Reviews
10+ Question Solved
Related Book For 
Cambridge IGCSE And O Level Additional Mathematics Coursebook
ISBN: 9781108411660
2nd Edition
Authors: Sue Pemberton
Question Posted:
