

The table shows experimental values of the variables x and y. The variables are known to be
Question:
The table shows experimental values of the variables x and y.
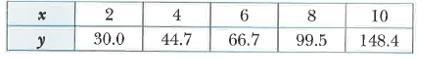
The variables are known to be related by the equation y = a × eax+b where a and b are constants.
a. Draw the graph of ln y against x.
b. Use your graph to estimate the value of a and the value of b.
c. Estimate the value of x when y = 50.
Fantastic news! We've Found the answer you've been seeking!
Step by Step Answer:
ANWER To solve this problem well first take the natural logarithm ln of both sides of the equation y ...View the full answer

Answered By
Raunak Agarwal
Teaching is my hobby and now my profession. I teach students of CA and CFA(USA) in batches of 100 students and have a 5 year experience.
1+ Reviews
10+ Question Solved
Related Book For 

Cambridge IGCSE And O Level Additional Mathematics Coursebook
ISBN: 9781108411660
2nd Edition
Authors: Sue Pemberton
Question Posted:
