

The table shows experimental values of the variables x and y. The variables are known to be
Question:
The table shows experimental values of the variables x and y.
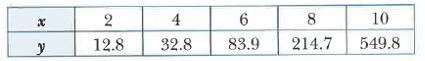
The variables are known to be related by the equation y = a × bx where a and b are constants.
a. Draw the graph of lg y against x.
b. Use your graph to estimate the value of a and the value of b.
Fantastic news! We've Found the answer you've been seeking!
Step by Step Answer:
To draw the graph of lg y against x and use it to estimate the values of a and b we will use the giv...View the full answer

Answered By
Stephen ouma
I have worked with different academic writing companies such as wriredom, writerbay, and Upwork. While working with these companies, I have helped thousands of students achieve their academic dreams. This is what I also intend to do here in SolutionInn
19+ Reviews
63+ Question Solved
Related Book For 

Cambridge IGCSE And O Level Additional Mathematics Coursebook
ISBN: 9781108411660
2nd Edition
Authors: Sue Pemberton
Question Posted:
