Question Answers
Textbooks
Search Textbook questions, tutors and Books
Oops, something went wrong!
Change your search query and then try again
Toggle navigation
FREE Trial
S
Books
FREE
Hire a Tutor
AI Tutor
New
AI Flashcards
FREE
Search
Search
Sign In
Register
study help
business
introduction to statistical investigations
Questions and Answers of
Introduction To Statistical Investigations
Consider the data given in Problem No. 11.20 and construct an EWMA control chart with λ = 0.1 and L = 2.7. Compare your results to those obtained with the CUSUM control chart.
The concentration (ppm) of a bath, measured on hourly basis for 20 h, is shown in Table 10.23(read down from left). The target process mean concentration is 80 ppm, and the process standard deviation
The data of Table 10.22 represent temperature (◦C) of a chemical process recorded every 5 min (read down from left).The target process mean temperature is 65 ◦C, and the process standard
An automotive company inspects the defects in ten cars, and the results are shown in Table 10.21. Set up an appropriate control chart, and conclude if the manufacturing process of the cars is under
A cloth manufacturer examines ten rolls of clothes each with 100 m length of cloth and counts the number of defects present in each roll. The results are shown in Table 10.20.Can you design a 3σ
The number of defects in twenty pieces of vertical blind each of 10 m length is as follows: 1, 3, 2, 5, 2, 4, 3, 2, 1, 3, 2, 4, 6, 3, 5, 1, 1, 2, 2, 3. Draw an appropriate control chart, and conclude
In a production process, a sample of 50 items is inspected on each day. The number of defective found in each sample is as follows: 1, 3, 4, 7, 9, 6, 13, 2, 5, 6.Draw an appropriate control chart and
Construct an appropriate control chart for the data given in Table 10.19, and comment on whether the process is under statistical control.
Table 10.18 displays the number of defective bearings found in each sample of size 200.(a) Compute a 3σ control limits for the number of defectives.(b) Display the control chart.(c) Analyze the
Consider two manufacturing processes for production of malleable iron castings, and the mean and standard deviation of the tensile strength of the castings resulting from these processes are shown in
A tire manufacturing company receives an order for a large quantity of tires with mean breaking energy 1000 J and standard deviation of breaking energy 10 J.The company wants to establish a control
The mean, range, and standard deviation of weight of 10 samples of size 9 taken from a manufacturing process are shown in Table 10.16.(a) Compute 3σ control limits for the mean, range, and standard
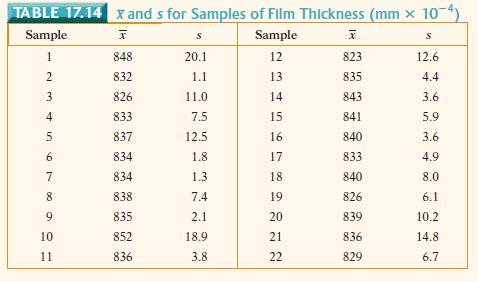
A machine is manufacturing compact disks with thickness shown in Table 10.15. Set up an x chart, R chart, and s chart, and comment on whether the manufacturing process is under statistical control.
A ball bearing manufacturing company supplies bearing of inner ring diameter equal to be 50 mm. A customer accepts bearing if its mean diameter lies within a range of 50 ± 0.002 mm. As the customer
Design an acceptance sampling plan for which AQL is 0.10, RQL is 0.05, αis 0.05, and β is 0.05.
Design an acceptance sampling plan for which AQL is 0.05, RQL is 0.10, αis 0.05, and β is 0.05.
Design an acceptance sampling plan for which AQL is 0.05, RQL is 0.05, αis 0.05, and β is 0.10.
Design an acceptance sampling plan for which AQL is 0.05, RQL is 0.05, αis 0.10, and β is 0.05.
Design an acceptance sampling plan for which AQL is 0.05, RQL is 0.05, αis 0.05, and β is 0.10.
Design an acceptance sampling plan for which AQL is 0.05, RQL is 0.05, αis 0.05, and β is 0.05.
A company uses the following acceptance sampling procedure. A batch is accepted if not more than two items are found to be defective in a sample of 50 items taken randomly from the batch; otherwise,
An article entitled “Optimization of the conductivity and yield of chemically synthesized polyaniline using a design of experiments” published by E.J. Jelmy et al.in Journal of Applied Polymer
An article entitled “Central composite design optimization and artificial neural network modeling of copper removal by chemically modified orange peel” published by A. Ghosh et al. in
Consider the following model yˆ = 1.665 − 32 × 10−5x1 + 372 × 10−5x2 + 1 × 10−5x2 1 + 68 × 10−5x2 2 − 1 × 10−5x1x2 Find the stationary point. Determine the nature of the
In a study to determine the nature of response system that relates yield of electrochemical polymerization (y) with monomer concentration (x1) and polymerization temperature x2, the following
Construct a Box Behnken design for the experiment stated in Problem 9.5.
A disk-type test rig is designed and fabricated to measure the wear of a textile composite under specified test condition. The ranges of the three factors chosen are as follows:Temperature : 500
In a certain experiment, the two factors are temperature and contact pressure.Two central composite designs were constructed using following ranges on the two factors.Temperature : 500 ◦F − 1000
Find the path of steepest ascent for the following first-order model yˆ = 1000 + 100x1 + 50x2 where the variables are coded as −1 ≤ xi ≤ 1.
An article entitled “Fermentation of molasses by Zymomonas mobilis: Effects on temperature and sugar concentration on ethanol production” published by M. L. Cazetta et al. in Bioresource
An article entitled “Screening of factors influencing Cu(II) extraction by soybean oil-based organic solvents using fractional factorial design” published by S.H.Chang et al. in Journal of
Consider the data from the first replicate of Problem 8.4. Suppose that these experiments could not all be run using the same batch of material. Suggest a reasonable confounding scheme and analyze
Consider the data from the first replicate of Problem 8.6. Suppose that these experiments could not all be run using the same batch of material. Construct a design with two blocks of four
Consider the experiment described in Problem 8.4. Analyze the experiment assuming that each replicate represents a block and draw conclusions.
Consider the experiment described in Problem 8.1. Analyze the experiment assuming that each replicate represents a block and draw conclusions.
Consider the experiment described in Problem 8.7. Analyze the data using Yates’ algorithm. Check if the results obtained are same with those obtained in Problem 8.7.
Consider the experiment described in Problem 8.6. Analyze the data using Yates’algorithm. Check if the results obtained are same with those obtained in Problem 8.6.
An article entitled “Rotary ultrasonic machining of ceramic matrix composites:feasibility study and designed experiments,” published by Z.C. Li et al. in International Journal of Machine Tools &
An article entitled “Designed experiments to stabilize blood glucose levels,”published by R.E. Chapman and V. Roof in Quality Engineering, 12, 83–87, 1999, reported on the effects of amount of
An article entitled “Study of NADH stability using ultraviolet-visible spectrophotometric analysis and factorial design” published by L. Rovar et al. in Analytical Biochemistry, 260, 50–55,
An experiment was carried out to investigate the effects of ratio of PP and LLDRE (X1) and concentration of red mud particles (X2) on the tensile strength (Y )of red mud filled PP/LLDPE blended
In order to study the effects of pH (5.8 and 7.4) and buffer concentration of catholyte (25 and 150 mM) on the power density of a fuel cell, the 22 factorial design of experiment was carried out and
A 22 factorial experiment was conducted to study the effects of temperature(25 and 65 ◦C) and catalyst concentration (0.5 and 1.5%) on transesterification of vegetable oil to methanol. The results
In order to investigate the effects of type of resin, distance between blade and anvil, and weight fraction of nonvolatile content in a lacquer on the thickness of lacquer film on a substrate, the
Cauliflowers were grown in a greenhouse under treatments consisting of four types of soils and three types of fertilizers. In order to examine the effects of soil and fertilizer, a factorial
The austenite stainless steels are used for making various engineering components in power plants and automobile industries. In order to examine the effect of cyclic loading on fatigue properties of
A completely randomized experiment was carried out to examine the effect of an inductor current sense resistor on the power factor of a PFC circuit. Four resistor values were chosen and three
Prove that residual sum of squares (RSS) is independent of pairs βˆ0 and βˆ1.
Prove that Var() = ' nx
Consider the weight X1, age X2 and height X3 of 12 students of a school given in Table 6.9. Find the least square linear regression line of X1 on X2 and X3. Also find the coefficient of determination.
Students’ scores in the probability course examination, x, and on the semester CGPA, y, are given in Table 6.8.(a) Calculate the least square regression line for the data of Table 6.8.(b) Plot the
Show that for any collection (X1, X2,..., Xn) of random variables the covariance matrix = (Cov(Xi, Xj)), which is symmetric, is always positive definite.
A sample of size 27 from a bivariate normal population had an observed correlation of 0.2. Can you discard the claim that components are independent? Use 5%level of significance.
A sample of size 100 from a normal population had an observed correlation of 0.6. Is the shortfall from the claimed correlation of at least 0.75 significant at 5%level of significance? What would a
The correlation between scores on a traditional aptitude test and scores on a final test is known to be approximately 0.7. A new aptitude test has been developed and is tried on a random sample of
A random sample of size 8 from a bivariate normal distribution yields a value of the correlation coefficient of 0.75. Would we accept or reject at the 5% significance level, the hypothesis that ρ =
A fisheries researcher wishes to conclude that there is a difference in the mean weights of three species of fish (A,B,C) caught in a large lake. The data are shown in Table 5.42. Using ANOVA method,
Suppose that to compare the food quality of three different hostel students on the basis of the weight on 15 students as shown in Table 5.41.The means of these three samples are 68, 80, and 77. We
To examine the effects of pets and friends in stressful situations, researchers recruited 45 people to participate in an experiment and data are shown in Table 5.40.Fifteen of the subjects were
An auto rental firm is using 15 identical motors that are adjusted to run at fixed speeds to test three different brands of gasoline. Each brand of gasoline is assigned to exactly five of the motors.
Historical data indicate that 4% of the components produced at a certain manufacturing facility are defective. A particularly acrimonious labor dispute has recently been concluded, and management is
An oil company claims that the sulfur content of its diesel fuel is at most 0.15 percent. To check this claim, the sulfur contents of 40 randomly chosen samples were determined; the resulting sample
Polychlorinated biphenyls (PCB), used in the production of large electrical transformers and capacitors, are extremely hazardous when released into the environment. Two methods have been suggested to
Twenty-five men between the ages of 25 and 30, who were participating in a well-known heart study carried out in New Delhi, were randomly selected. Of these,
Three kinds of lubricants are being prepared by a new process. Each lubricant is tested on a number of machines, and the result is then classified as acceptable or nonacceptable. The data in the
In a study of the effect of two treatments on the survival of patients with a certain disease, each of the 156 patients was equally likely to be given either one of the two treatments. The result of
Can it be concluded from the following sample data of Table 5.35 that the proportion of employees favouring a new pension plan is not the same for three different agencies. Use α = 0.05.
Use the 10% level of significance to perform a hypothesis test to see if there is any evidence of a difference between the Channel A viewing area and Channel B viewing area in the proportion of
A politician claims that she will receive at least 60% o the votes in an upcoming election. The results of a simple random sample of 100 voters showed that 58 of those sampled would vote for her.
A randomly chosen group of 20,000 nonsmokers and one of 10,000 smokers were followed over a 10-year period. The data of Table 5.34 relate the numbers of them that developed lung cancer during the
A sample of 300 cars having cellular phones and one of 400 cars without phones are tracked for 1 year. Table 5.33 gives the number of cars involved in accidents over that year. Use the above to test
Consider the data of Table 5.32 that correspond to 60 rolls of a die. Test the hypothesis that the die is fair (Pi = 1 6 , i = 1,..., 6), at 0.5% level of significance.
The proportions of blood types O, A, B and AB in the general population of a particular country are known to be in the ratio 49:38:9:4, respectively. A research team, investigating a small isolated
A builder claims that a particular brand water heaters are installed in 70% of all homes being constructed today in the city of Delhi, India. Would you agree with this claim if a random survey of new
A study was investigated to see if Southern California earthquakes of at least moderate size (having values of at least 4.4 on the Richter Scale) are more likely to occur on certain days of the week
Suppose the weekly number of accidents over a 60-week period in Delhi is given in Table 5.29. Test the hypothesis that the number of accidents in a week has a Poisson distribution. Assume α = 0.05.
Elongation measurements are made of ten pieces on steel, five of which are treated with method A (aluminum only), and the remaining five are method B (aluminum plus calcium). The results obtained are
Two analysts A and B each make +ve determinations of percent of iron content in a batch of prepared ore from a certain deposit. The sample variances for A and B turned out to be 0.4322 and 0.5006,
It is desired to determine whether there is less variability in the marks of probability and statistics course by IITD students than in that by IITB students.If independent random samples of size 10
Consider the strength of a synthetic fiber that is possibly affected by the percentage of cotton in the fiber. Five levels of this percentage are considered with five observations at each level. The
Random samples of the yields from the usage of two different brands of fertilizers produced the following results: n1 = 10, X¯ = 90.13,s2 1 = 4.02; n2 = 10, Y¯ =92.70,s2 2 = 3.98.Test at 1 and 5%
The life of certain electrical equipment is normally distributed. A random sample of lives of twelve such equipments has a standard deviation of 1.3 years.Test the hypothesis that the standard
An automobile manufacturer claims that the average mileage of its new twowheeler will be at least 40 km. To verify this claim 15 test runs were conducted independently under identical conditions and
In a certain chemical process, it is very important that a particular solution that is to be used as a reactant has a pH of exactly 8.20. A method for determining pH that is available for solutions
Let X be a discrete type random variable with PMF P(x; θ ) =θ x (1 − θ )1−x , x = 0, 1 0 otherwise .We test the simple hypothesis H0 : θ = 1 4 against the alternative composite hypothesis H1
Let X1, X2,..., Xn denote a random sample of size 20 from a Poisson distribution with mean θ. Show that the critical region C defined by 20 i=1 xi ≥ 4.
If X1, X2,..., Xn is a random sample from a beta distribution with parametersα = β = θ > 0, find a best critical region for testing H0 : θ = 1 against H1 : θ = 2.
Let X1, X2,..., Xn be a random sample from a distribution with the following PDF f (x; θ ) =θ xθ−1, 0 < x < ∞0 otherwise where θ > 0. Find a sufficient statistics for θ and show that a
Consider a queueing system that describes the number of telephone ongoing calls in a particular telephone exchange. The mean time of a queueing system is required to be at least 180 s. Past
Let X1, X2,..., X50 denote a random sample of size 50 from a normal distribution N(θ , 100). Find a uniformly most powerful critical region of size α = 0.10 for testing H0 : θ = 50 against H1 : θ
Let X1, X2,..., Xn and Y1, Y2,..., Yn be independent random samples from the two normal distributions N(0, θ1) and N(0, θ2).(a) Find the likelihood ratio test λ for testing the composite
Let Y1 < Y2 < ··· < Yn be the order statistics of a random sample of size 10 from a distribution with the following PDF f (x; θ ) = 1 2e−|x−θ|, − ∞ < x < ∞for all real θ. Find the
There has been a great deal of controversy in recent years over the possible dangers of living near a high-level electromagnetic field (EMF). After hearing many anecdotal tales of large increase
The standard deviation of the breaking strength of 100 cables was 180 pounds.Find 99% confidence limits for standard deviation.
A company has 500 cables. Forty cables were selected at random with a mean breaking strength of 2400 pounds and a standard deviation of 150 pounds.(a) What are the 95% confidence limits for
If the standard deviation of the lifetimes of light bulbs is estimated to be 100 hours. What should be the sample size in order to be 99% confident that the error in the estimated average lifetime
The contents of seven similar containers of sulfuric acid are 9.8, 10.2, 10.4, 9.8, 10.0, 10.2, and 9.6 liters. Find a 95% confidence interval for the mean of all such containers, assuming an
Let X¯ be the mean of a random sample of size n from N(μ, 25). Find the smallest sample size n such that (X¯ − 1, X¯ + 1) is a 0.95 level confidence interval for μ.
Let X1, X2,..., Xn be a random sample from the modified geometric distribution with PMF p(x; q) = (1 − q)x−1 q, x = 1, 2,....Prove that maximum likelihood estimator of q is qˆ = n ni=1 xi= 1 x¯.
If X1, X2,..., Xn is a random sample from N(θ , 1). Find a lower bound for the variance of an estimator of θ 2. Determine the minimum variance unbiased estimator of θ 2, and then compute its
Showing 1 - 100
of 3158
1
2
3
4
5
6
7
8
9
10
11
12
13
14
15
Last