

At the end of 2015, the U.S. Bureau of Economic Analysis posted the following data on the
Question:
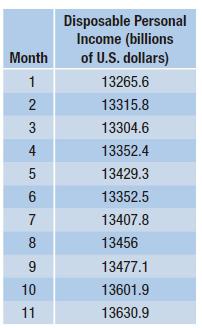
At the end of 2015, the U.S. Bureau of Economic Analysis posted the following data on the U.S. disposable personal income by month for the first 11 months of that year as indicated in this table:
a. Without making a scatter plot, what trend do you see in the data?
b. Draw a scatter plot. Describe the correlation.
c. Based on the trend, scatter plot, and correlation, what might you predict the personal income level was in December 2015?
Fantastic news! We've Found the answer you've been seeking!
Step by Step Answer:
a There is an increasing trend in the data Month Disposable ...View the full answer

Answered By
Marvine Ekina
Marvine Ekina
Dedicated and experienced Academic Tutor with a proven track record for helping students to improve their academic performance. Adept at evaluating students and creating learning plans based on their strengths and weaknesses. Bringing forth a devotion to education and helping others to achieve their academic and life goals.
PERSONAL INFORMATION
Address: , ,
Nationality:
Driving License:
Hobbies: reading
SKILLS
????? Problem Solving Skills
????? Predictive Modeling
????? Customer Service Skills
????? Creative Problem Solving Skills
????? Strong Analytical Skills
????? Project Management Skills
????? Multitasking Skills
????? Leadership Skills
????? Curriculum Development
????? Excellent Communication Skills
????? SAT Prep
????? Knowledge of Educational Philosophies
????? Informal and Formal Assessments
0 Reviews
10+ Question Solved
Related Book For 

Financial Algebra Advanced Algebra With Financial Applications
ISBN: 9781337271790
2nd Edition
Authors: Robert Gerver, Richard J. Sgroi
Question Posted:
