

Question: The stem and leaf plot shown is called a back-to-back stem-and-leaf plot, and combines two stem and leaf plots. It gives the semi-annual premiums for
The stem and leaf plot shown is called a back-to-back stem-and-leaf plot, and combines two stem and leaf plots. It gives the semi-annual premiums for the girls and boys in Van Buren High School who currently drive. The numbers between the two vertical lines represent the hundreds (left) and tens (right) digits. The numbers on the extreme left show the units digits for the girls. Notice they are written in ascending order as you move out from the middle. The numbers on the extreme right show the units digits for the boys.
a. How many girls at Van Buren HS drive?
b. How many boys at Van Buren HS drive?
c. Find the range of the annual premiums for all of the students.
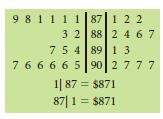
9 8 1 1 1 1 3 2 87 1 2 2 88 2 467 754 89 13 7 6 6 6 6 5 90 2777 1| 87 = $871 87| 1 = $871
Step by Step Solution
3.38 Rating (179 Votes )
There are 3 Steps involved in it
a No of girls at Van Bur... View full answer

Get step-by-step solutions from verified subject matter experts