

Consider the CVP graphs below for two providers operating in a fee-for-service environment: a. Assuming the graphs
Question:
Consider the CVP graphs below for two providers operating in a fee-for-service environment:
a. Assuming the graphs are drawn to the same scale, which provider has the greater fixed costs? The greater variable cost rate? The greater per unit revenue?
b. Which provider has the greater contribution margin?
c. Which provider needs the higher volume to break even?
d. How would the graphs below change if the providers were operating in a discounted fee-for-service environment? In a capitated environment?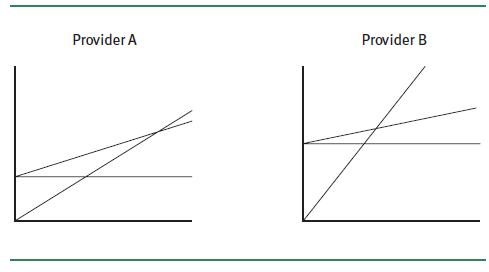
Fantastic news! We've Found the answer you've been seeking!
Step by Step Answer:

Answered By
Muhammad Umair
I have done job as Embedded System Engineer for just four months but after it i have decided to open my own lab and to work on projects that i can launch my own product in market. I work on different softwares like Proteus, Mikroc to program Embedded Systems. My basic work is on Embedded Systems. I have skills in Autocad, Proteus, C++, C programming and i love to share these skills to other to enhance my knowledge too.
1+ Reviews
10+ Question Solved
Related Book For 

Gapenski's Healthcare Finance An Introduction To Accounting And Financial Management
ISBN: 9781640551862
7th Edition
Authors: Kristin L. Reiter, Paula H. Song
Question Posted:
