

Question: Examine the peer group average ratios given in problems 17.4 and 17.5. Explain why the ratios are different between the managed care and nursing home
Examine the peer group average ratios given in problems 17.4 and 17.5. Explain why the ratios are different between the managed care and nursing home industries.
Problems 17.4
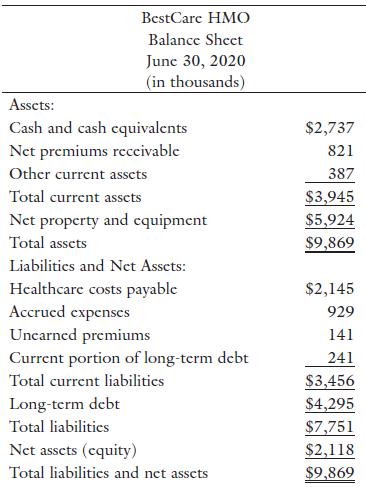
Consider the following financial statements for BestCare HMO, a not-for-profit managed care plan: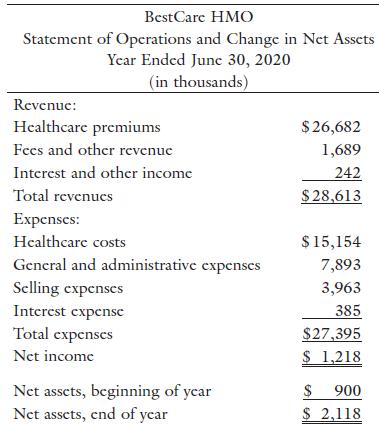
• Perform a Du Pont analysis on BestCare. Assume that the peer group average ratios are as follows: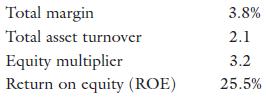
• Calculate and interpret the following ratios for BestCare: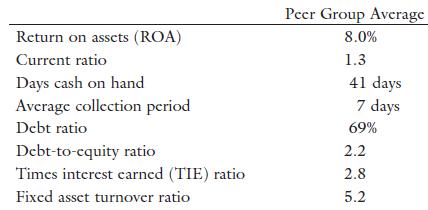
Problems 17.5
Consider the following financial statements for Green Valley Nursing Home, Inc., a for-profit, long-term care facility: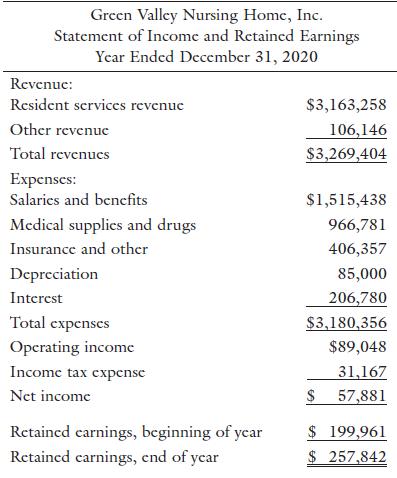
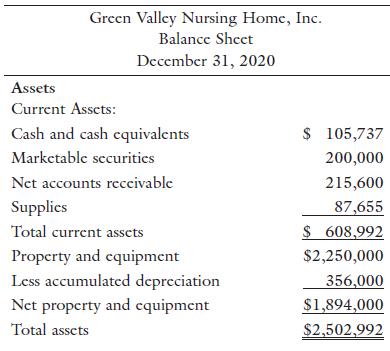
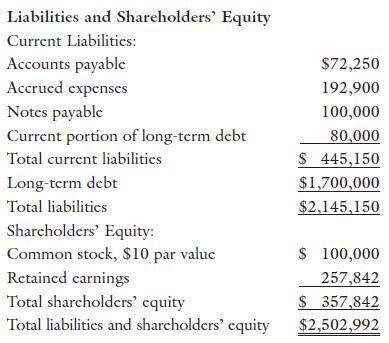
• Perform a Du Pont analysis on Green Valley. Assume that the peer group average ratios are as follows: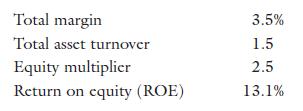
• Calculate and interpret the following ratios: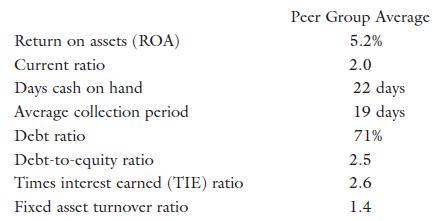
BestCare HMO Statement of Operations and Change in Net Assets Year Ended June 30, 2020 Revenue: (in thousands) Healthcare premiums Fees and other revenue Interest and other income $26,682 1,689 242 $28,613 Total revenues Expenses: Healthcare costs $ 15,154 General and administrative expenses Selling expenses 7,893 3,963 Interest expense 385 Total expenses Net income $27,395 $ 1,218 Net assets, beginning of year $ 900 Net assets, end of year $ 2,118
Step by Step Solution
3.39 Rating (152 Votes )
There are 3 Steps involved in it

Get step-by-step solutions from verified subject matter experts