

You are given the following set of data: a. Use a spreadsheet (or a calculator with a
Question:
You are given the following set of data:
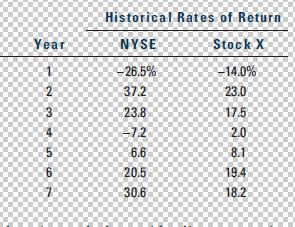
a. Use a spreadsheet (or a calculator with a linear regression function) to determine Stock X’s beta coefficient.
b. Determine the arithmetic average rates of return for Stock X and the NYSE over the period given. Calculate the standard deviations of returns for both Stock X and the NYSE.
c. Assume that the situation during Years 1 to 7 is expected to prevail in the future (i.e., ^r x ¼ ¯rx;^rM ¼ ¯rM, and both σX and bX in the future will equal their past values). Also assume that Stock X is in equilibrium—that is, it plots on the Security Market Line. What is the risk-free rate?
d. Plot the Security Market Line.
e. Suppose you hold a large, well-diversified portfolio and are considering adding to that portfolio either Stock X or another stock, Stock Y, which has the same beta as Stock X but a higher standard deviation of returns. Stocks X and Y have the same expected returns: ^r x ¼ ^ry ¼ 10:6%. Which stock should you choose?
Step by Step Answer:
a To calculate the beta coefficient for Stock X you can use the formula for the slope of the regress...View the full answer


Financial management theory and practice
ISBN: 978-1439078099
13th edition
Authors: Eugene F. Brigham and Michael C. Ehrhardt
