

Figure 5.7 shows a number of yield curves at various points in time. Go to www.treasury.gov, and
Question:
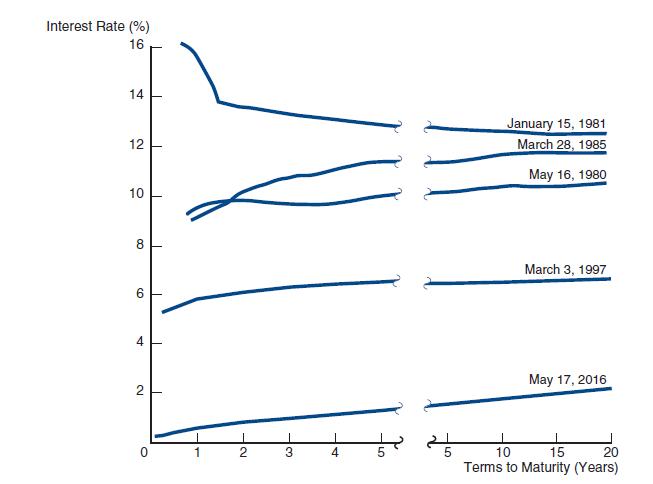
Figure 5.7 shows a number of yield curves at various points in time. Go to www.treasury.gov, and in the “Resource Center” at the top of the page click on “Data and Charts Center.” Find the Treasury yield curve. Does the current yield curve fall above or below the most recent one listed in Figure 5.7? Is the current yield curve flatter or steeper than the most recent one reported in Figure 5.7?
Figure 5.7
Fantastic news! We've Found the answer you've been seeking!
Step by Step Answer:

Answered By
Muhammad Umair
I have done job as Embedded System Engineer for just four months but after it i have decided to open my own lab and to work on projects that i can launch my own product in market. I work on different softwares like Proteus, Mikroc to program Embedded Systems. My basic work is on Embedded Systems. I have skills in Autocad, Proteus, C++, C programming and i love to share these skills to other to enhance my knowledge too.
1+ Reviews
10+ Question Solved
Related Book For 

Financial Markets And Institutions
ISBN: 9781292215006
9th Global Edition
Authors: Stanley Eakins Frederic Mishkin
Question Posted:
