

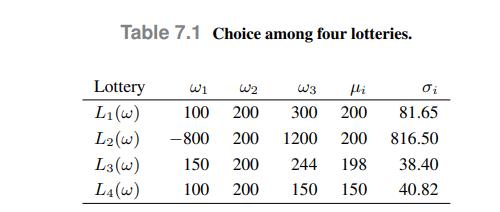
Consider the choice among the four lotteries depicted in Table 7.1. These lotteries are characterized by uncertain
Question:
Consider the choice among the four lotteries depicted in Table 7.1. These lotteries are characterized by uncertain payoffs, which we model by four discrete random variables 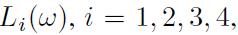 taking values corresponding to three equally likely outcomes 1,2 , and 3 . For each \(L_{i}(ω)\), in the table we also report its expected value
 and standard deviation
  . Which lottery should we choose?
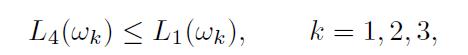
It is easy to see that lottery \(L_{4}\) would not be chosen, since its payoff is dominated by \(L_{1}\) (as well as by \(L_{3}\) ):
with strict inequality in scenario ω3. Lottery \(L_{2}\) is obtained from \(L_{1}\) by shifting a payoff of 900 units from scenario ω1 to ω3 . Thus, we do not change the expected value, but the payoff has a much larger variability, as measured by the standard deviation. Many would agree that, since the expected value is the same and there is less uncertainty, lottery \(L_{1}\) should be preferred to \(L_{2}\).
Actually, this is a matter of individual taste and depends on how much we like or dislike taking risk. If we are risk-averse, chances are that we may even like \(L_{3}\) the most. This lottery is obtained from \(L_{1}\) by increasing the payoff for event ω1 by 50 and decreasing the payoff for ω3 by 56 . Thus, the expected value μ3 is only 198 , but the standard deviation is considerably reduced.
Data From Table 7.1
Step by Step Answer:


An Introduction To Financial Markets A Quantitative Approach
ISBN: 9781118014776
1st Edition
Authors: Paolo Brandimarte
