

Question: The following cash-flow pattern has two IRRs. Use Excel to draw a graph of the NPV of these cash flows as a function of the
The following cash-flow pattern has two IRRs. Use Excel to draw a graph of the NPV of these cash flows as a function of the discount rate. Then use the IRR function to identify the two IRRs. Would you invest in this project if the opportunity cost were 20%?
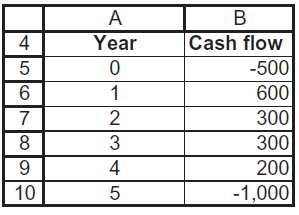
B Year Cash flow 4 -500 600 300 300 8 3 4 200 -1,000 10
Step by Step Solution
★★★★★
3.45 Rating (171 Votes )
There are 3 Steps involved in it
1 Expert Approved Answer
Step: 1 Unlock

Question Has Been Solved by an Expert!
Get step-by-step solutions from verified subject matter experts
Step: 2 Unlock
Step: 3 Unlock
Document Format (2 attachments)
1553_61d57f259d17a_810503.pdf
180 KBs PDF File
1553_61d57f259d17a_810503.docx
120 KBs Word File