

Question: The comparative statements of Corbin Company are presented below. Additional data: The common stock recently sold at $19.50 per share. Instructions Compute the following ratios
The comparative statements of Corbin Company are presented below.
Additional data:
The common stock recently sold at $19.50 per share.
Instructions
Compute the following ratios for 2017.
(a) Current ratio.
(b) Acid-test ratio.
(c) Accounts receivable turnover.
(d) Inventory turnover.
(e) Profit margin.
(f) Asset turnover.
(g) Return on assets.
(h) Return on common stockholders’ equity.
(i) Earnings per share.
(j) Price-earnings ratio.
(k) Payout ratio.
(l) Debt to assets ratio.
(m) Times interest earned.
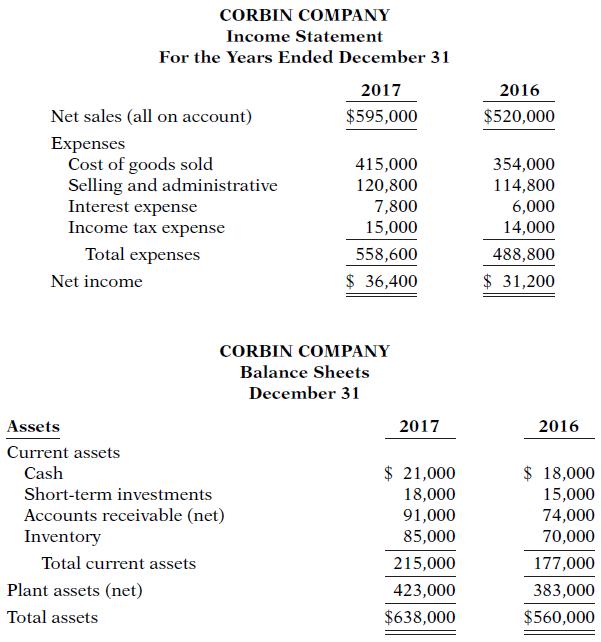
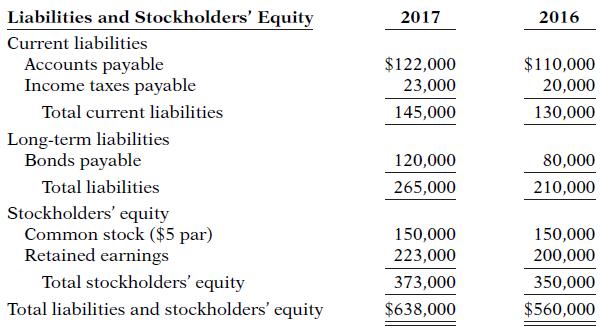
CORBIN COMPANY Income Statement For the Years Ended December 31 2017 2016 Net sales (all on account) $595,000 $520,000 Expenses Cost of goods sold Selling and administrative Interest expense 415,000 120,800 7,800 15,000 354,000 114,800 6,000 14,000 Income tax expense Total expenses 558,600 488,800 Net income $ 36,400 $ 31,200 CORBIN COMPANY Balance Sheets December 31 Assets 2017 2016 Current assets $ 21,000 18,000 $ 18,000 15,000 74,000 70,000 Cash Short-term investments Accounts receivable (net) Inventory 91,000 85,000 Total current assets 215,000 177,000 Plant assets (net) 423,000 383,000 Total assets $638,000 $560,000
Step by Step Solution
3.41 Rating (173 Votes )
There are 3 Steps involved in it
Ratios for 2017 a Current ratio current assets divided by current liabilities 215000 145000 14828 b ... View full answer

Get step-by-step solutions from verified subject matter experts