

Question: Financial information for Messersmith Company is presented below. Additional information: 1. Inventory at the beginning of 2016 was $118,000. 2. Total assets at the beginning
Financial information for Messersmith Company is presented below.
Additional information:
1. Inventory at the beginning of 2016 was $118,000.
2. Total assets at the beginning of 2016 were $630,000.
3. No common stock transactions occurred during 2016 or 2017.
4. All sales were on account. Accounts receivable, net at the beginning of 2016, were $88,000.
5. Notes payable are classified as current liabilities.
Instructions
(a) Indicate, by using ratios, the change in liquidity and profitability of Messersmith Company from 2016 to 2017. (Note: Not all profitability ratios can be computed.)
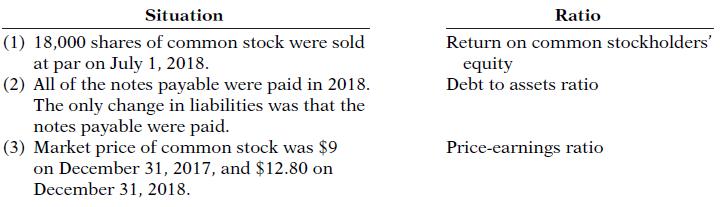
(b) Given below are three independent situations and a ratio that may be affected. For each situation, compute the affected ratio (1) as of December 31, 2017, and (2) as of December 31, 2018, after giving effect to the situation. Net income for 2018 was $50,000. Total assets on December 31, 2018, were $700,000.
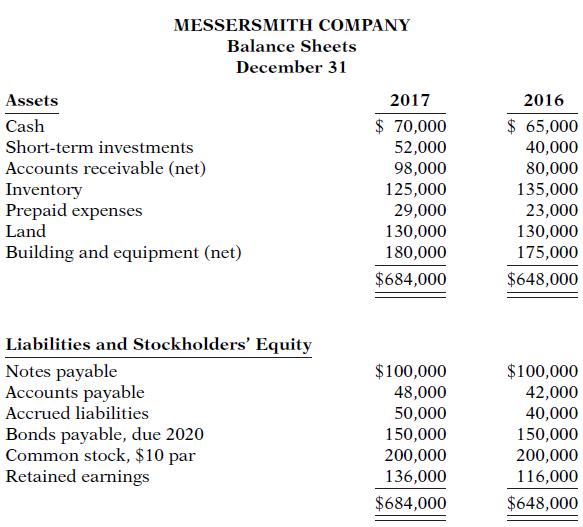
MESSERSMITH COMPANY Balance Sheets December 31 Assets 2017 2016 $ 70,000 $ 65,000 40,000 80,000 135,000 23,000 130,000 175,000 Cash Short-term investments Accounts receivable (net) Inventory Prepaid expenses Land 52,000 98,000 125,000 29,000 130,000 180,000 Building and equipment (net) $684,000 $648,000 Liabilities and Stockholders' Equity Notes payable Accounts payable Accrued liabilities $100,000 $100,000 Bonds payable, due 2020 Common stock, $10 par Retained earnings 48,000 50,000 150,000 200,000 136,000 42,000 40,000 150,000 200,000 116,000 $684,000 $648,000
Step by Step Solution
3.42 Rating (168 Votes )
There are 3 Steps involved in it
a Liquidity Ratios Current Ratio Current Assets Current Liabilities 2017 349000 198000 176 2016 303000 182000 167 The current ratio increased from 2016 to 2017 indicating an improvement in liquidity Q... View full answer

Get step-by-step solutions from verified subject matter experts