

Question: Using the following data from the comparative balance sheet of Goody Company, illustrate horizontal analysis. December 31, 2017 December 31, 2016 Accounts receivable $ 520,000
Using the following data from the comparative balance sheet of Goody Company, illustrate horizontal analysis.
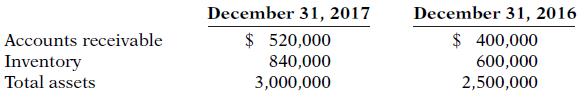
December 31, 2017 December 31, 2016 Accounts receivable $ 520,000 $ 400,000 Inventory Total assets 840,000 3,000,000 600,000 2,500,000
Step by Step Solution
★★★★★
3.52 Rating (166 Votes )
There are 3 Steps involved in it
1 Expert Approved Answer
Step: 1 Unlock

HORIZONTAL ANALYSIS December 312017 A December 312016 B Incerase Amoun... View full answer
Question Has Been Solved by an Expert!
Get step-by-step solutions from verified subject matter experts
Step: 2 Unlock
Step: 3 Unlock
Document Format (2 attachments)
426_61d57f260992b_827095.pdf
180 KBs PDF File
426_61d57f260992b_827095.docx
120 KBs Word File