

Question: Answer using excel file. BE14-3 Using the following data from the comparative balance sheet of Goody Company, illustrate horizontal analysis. December 31, 2015 December 31,
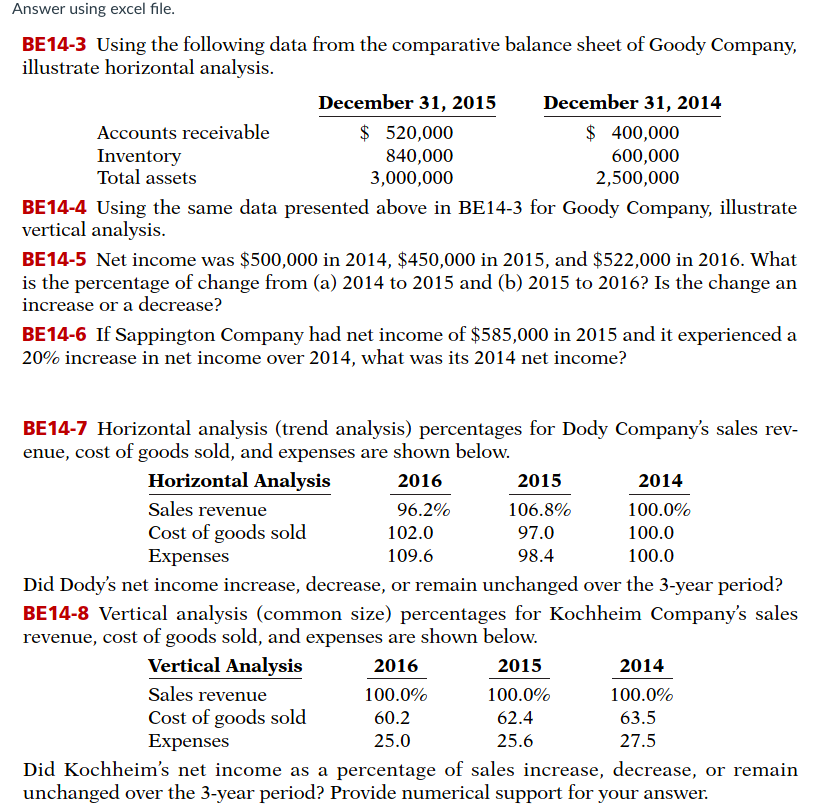
Answer using excel file. BE14-3 Using the following data from the comparative balance sheet of Goody Company, illustrate horizontal analysis. December 31, 2015 December 31, 2014 Accounts receivable $ 520,000 $ 400,000 Inventory 840,000 600,000 Total assets 3,000,000 2,500,000 BE14-4 Using the same data presented above in BE14-3 for Goody Company, illustrate vertical analysis. BE14-5 Net income was $500,000 in 2014, $450,000 in 2015, and $522,000 in 2016. What is the percentage of change from (a) 2014 to 2015 and (b) 2015 to 2016? Is the change an increase or a decrease? BE14-6 If Sappington Company had net income of $585,000 in 2015 and it experienced a 20% increase in net income over 2014, what was its 2014 net income? BE14-7 Horizontal analysis (trend analysis) percentages for Dody Company's sales rev- enue, cost of goods sold, and expenses are shown below. Horizontal Analysis 2016 2015 2014 Sales revenue 96.2% 106.8% 100.0% Cost of goods sold 102.0 97.0 100.0 Expenses 109.6 98.4 100.0 Did Dody's net income increase, decrease, or remain unchanged over the 3-year period? BE14-8 Vertical analysis (common size) percentages for Kochheim Company's sales revenue, cost of goods sold, and expenses are shown below. Vertical Analysis 2016 2015 2014 Sales revenue 100.0% 100.0% 100.0% Cost of goods sold 60.2 62.4 63.5 Expenses 25.0 25.6 27.5 Did Kochheim's net income as a percentage of sales increase, decrease, or remain unchanged over the 3-year period? Provide numerical support for your answer. Answer using excel file. BE14-3 Using the following data from the comparative balance sheet of Goody Company, illustrate horizontal analysis. December 31, 2015 December 31, 2014 Accounts receivable $ 520,000 $ 400,000 Inventory 840,000 600,000 Total assets 3,000,000 2,500,000 BE14-4 Using the same data presented above in BE14-3 for Goody Company, illustrate vertical analysis. BE14-5 Net income was $500,000 in 2014, $450,000 in 2015, and $522,000 in 2016. What is the percentage of change from (a) 2014 to 2015 and (b) 2015 to 2016? Is the change an increase or a decrease? BE14-6 If Sappington Company had net income of $585,000 in 2015 and it experienced a 20% increase in net income over 2014, what was its 2014 net income? BE14-7 Horizontal analysis (trend analysis) percentages for Dody Company's sales rev- enue, cost of goods sold, and expenses are shown below. Horizontal Analysis 2016 2015 2014 Sales revenue 96.2% 106.8% 100.0% Cost of goods sold 102.0 97.0 100.0 Expenses 109.6 98.4 100.0 Did Dody's net income increase, decrease, or remain unchanged over the 3-year period? BE14-8 Vertical analysis (common size) percentages for Kochheim Company's sales revenue, cost of goods sold, and expenses are shown below. Vertical Analysis 2016 2015 2014 Sales revenue 100.0% 100.0% 100.0% Cost of goods sold 60.2 62.4 63.5 Expenses 25.0 25.6 27.5 Did Kochheim's net income as a percentage of sales increase, decrease, or remain unchanged over the 3-year period? Provide numerical support for your
Step by Step Solution
There are 3 Steps involved in it

Get step-by-step solutions from verified subject matter experts