

Figure 15 gives the percentage of persons 25 years and over who have completed four or more
Question:
Figure 15 gives the percentage of persons 25 years and over who have completed four or more years of college.
Figure 15
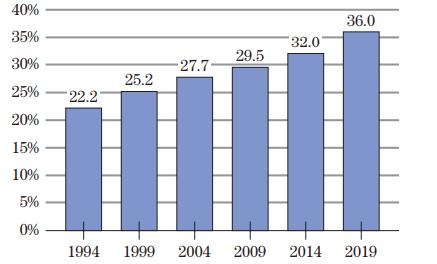
(a) Obtain the least-squares line that fits these data. (Let x = 0 correspond to 1994.)
(b) Estimate the percentage for the year 2017.
(c) If the trend determined by the line in part (a) continues, when will the percentage reach 41.1?
Fantastic news! We've Found the answer you've been seeking!
Step by Step Answer:
a Let x be the number of years after 1994 then y 0521x ...View the full answer

Answered By
Carly Cimino
As a tutor, my focus is to help communicate and break down difficult concepts in a way that allows students greater accessibility and comprehension to their course material. I love helping others develop a sense of personal confidence and curiosity, and I'm looking forward to the chance to interact and work with you professionally and better your academic grades.
12+ Reviews
21+ Question Solved
Related Book For 

Finite Mathematics And Its Applications
ISBN: 9780137616619
13th Edition
Authors: Larry J. Goldstein, David I. Schneider, Martha J. Siegel , Jill Simmons
Question Posted:
