Consider the following data on real GDP per capita in Canada: a. Calculate the percentage growth rates
Question:
Consider the following data on real GDP per capita in Canada:
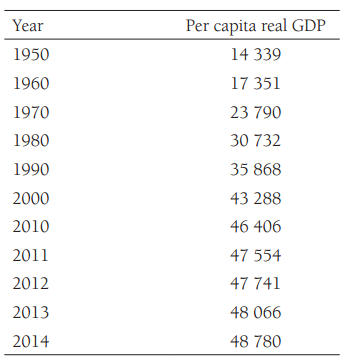
a. Calculate the percentage growth rates in real GDP per capita in each of the years 2011 through 2014, from the previous year.
b. Now, instead of calculating the annual percentage growth rates in the years 2011 through 2014 directly, use as an approximation 100 x (logyt - logyt - 1), where yt is real per capita GDP in year t. How close does this approximation come to the actual growth rates you calculated in part (a)?
c. Repeat parts (a) and (b), but now calculate the percentage rates of growth in real per capita GDP from 1950 to 1960, from 1960 to 1970, from 1970 to 1980, from 1980 to 1990, 1990 to 2000, and 2000 to 2010. In this case, how large an error do you make by approximating the growth rate by the change in the log? Why is there a difference here relative to parts (a) and (b)?
d. During what decade from 1950 to 2010 was growth in real per capita GDP the highest? When was it the lowest?
Step by Step Answer:
Calculating Growth Rates Data a Actual Percentage Growth Rates 20012010 2011 24...View the full answer