

Question: Figure 14.1 shows aggregate planned expenditure when the price level is 100. When the price level increases to 110, aggregate planned expenditure changes by $0.5
Figure 14.1 shows aggregate planned expenditure when the price level is 100. When the price level increases to 110, aggregate planned expenditure changes by $0.5 trillion. What is the quantity of real GDP demanded when the price level is 100 and 110?
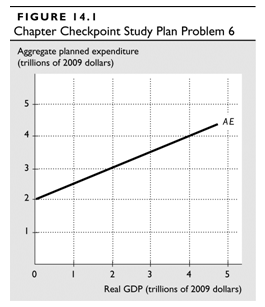
FIGURE 14.1 Chapter Checkpoint Study Plan Problem 6 Aggregate planned expenditure (trillions of 2009 dollars) AE Real GDP (trillions of 2009 dollars)
Step by Step Solution
★★★★★
3.39 Rating (183 Votes )
There are 3 Steps involved in it
1 Expert Approved Answer
Step: 1 Unlock

When the price level is 100 the AE curve in Figure 1... View full answer
Question Has Been Solved by an Expert!
Get step-by-step solutions from verified subject matter experts
Step: 2 Unlock
Step: 3 Unlock
Document Format (2 attachments)
1448_6054778c3443c_660875.pdf
180 KBs PDF File
1448_6054778c3443c_660875.docx
120 KBs Word File