

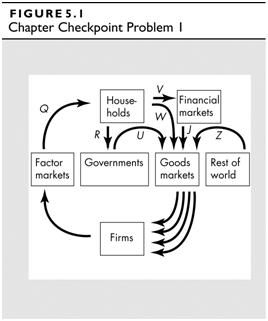
Figure 5.1 shows the flows of income and expenditure in an economy. In 2013, U was $2
Question:
Fantastic news! We've Found the answer you've been seeking!
Step by Step Answer:
Total income which is flow Q equals total expenditure the sum of consumption expendi...View the full answer

Answered By
Moses mwangi
With prior writing experience, be sure that I will give a great grade, If not an A+, it will be something close to this. My reviews speaks it all, Try me!!
78+ Reviews
157+ Question Solved
Related Book For 
Question Posted:
