

Figure 7.2 shows that before the 1990s, M1+ velocity generally rose over time. Suggest some explanations for
Question:
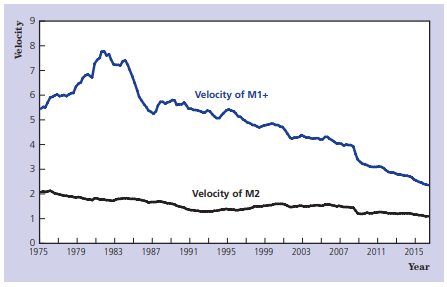
Figure 7.2 shows that before the 1990s, M1+ velocity generally rose over time. Suggest some explanations for this upward trend.
Fantastic news! We've Found the answer you've been seeking!
Step by Step Answer:
The general rise in velocity before the 1990s is most like...View the full answer

Answered By
GERALD KAMAU
non-plagiarism work, timely work and A++ work
6+ Reviews
11+ Question Solved
Related Book For 

Macroeconomics
ISBN: 978-0134646350
8th Canadian Edition
Authors: Andrew B. Abel, Ben S. Bernanke, Dean Croushore, Ronald D. Kneebone
Question Posted:
