

Plot the short-run Phillips curve and aggregate supply curve for 2017 and mark the points A, B,
Question:
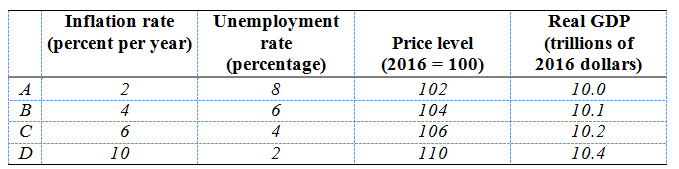
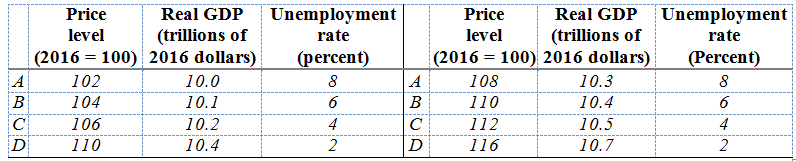
The left part of the table describes four possible situations that might arise in 2017, depending on the level of aggregate demand in 2017. The right part of the table describes four possible situations that might arise in 2018.
Fantastic news! We've Found the answer you've been seeking!
Step by Step Answer:
The figures are above Also above is a table with the data necessary to plot the ...View the full answer

Answered By
WAHIDUL HAQUE
hello,
I'm a professional academic solution provider working as a freelance academic solution provider since 7 years. I have completed numerous projects. Help lots of students to get good marks in their exams and quizzes. I can provide any type of academic help to your homework, classwork etc, if you are a student of Accounting, Finance, Economics, Statistics. I believe in satisfying client by my work quality, rather than making one-time profit. I charge reasonable so that we make good long term relationship. why will you choose me? i am an extremely passionate, boldly honest, ethically driven and pro-active contractor that holds each of my clients in high regards throughout all my business relations. in addition, I'll always make sure that I'm giving my 100% better in every work that will be entrusted to me to be able to produce an outcome that will meet my client's standards. so if you are a student that is now reading my profile and considering me for your academic help. please feel free to look through my working history, feedback and contact me if you see or read something that interests you. I appreciate your time and consideration.
regards
233+ Reviews
368+ Question Solved
Related Book For 
Question Posted:
