

Question: Plot the short-run Phillips curve and aggregate supply curve for 2018 and mark the points A, B, C, and D on each curve that correspond
Plot the short-run Phillips curve and aggregate supply curve for 2018 and mark the points A, B, C, and D on each curve that correspond to the data in the left part of the table.
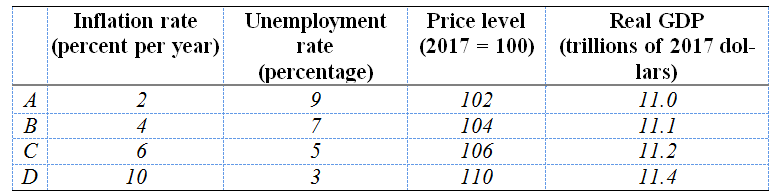
The left part of the table describes four situations that might arise in 2018, depending on the level of aggregate demand. The right part of the table describes four situations that might arise in 2019.
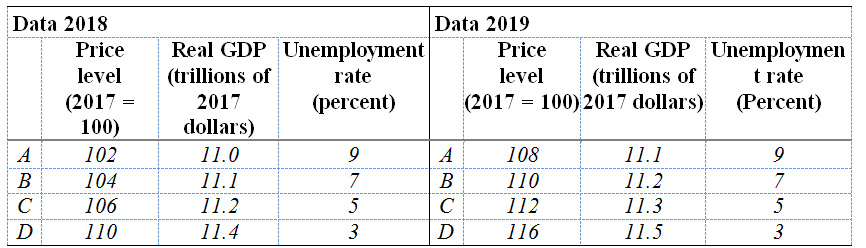
Inflation rate (percent per year) Price level (2017 = 100) Unemployment rate Real GDP (trillions of 2017 dol- (percentage) lars) 102 11.0 4 B 11.1 104 5 106 11.2 11.4 10 3 110 Data 2018 Price level Real GDP Unemployment rate Data 2019 Price level Real GDP Unemploymen (trillions of (trillions of t rate (2017 = 100) 2017 dollars) (2017 = 100) 2017 (percent) (Percent) dollars) 102 11.0 108 11.1 104 11.1 110 11.2 106 11.2 112 11.3 5 D 110 11.4 3 D 116 11.5 3 i--.--- ---
Step by Step Solution
3.44 Rating (163 Votes )
There are 3 Steps involved in it
Use the data in the table above to plot the Phillips curve and the aggregate sup... View full answer

Get step-by-step solutions from verified subject matter experts
Document Format (2 attachments)
1448_6054778c32f42_660830.pdf
180 KBs PDF File
1448_6054778c32f42_660830.docx
120 KBs Word File