

The left part of the table describes four possible situations that might arise in 2020, depending on
Question:
The left part of the table describes four possible situations that might arise in 2020, depending on the level of aggregate demand in 2020. The right part of the table describes four possible situations that might arise in 2021. Use the table to work Problems.
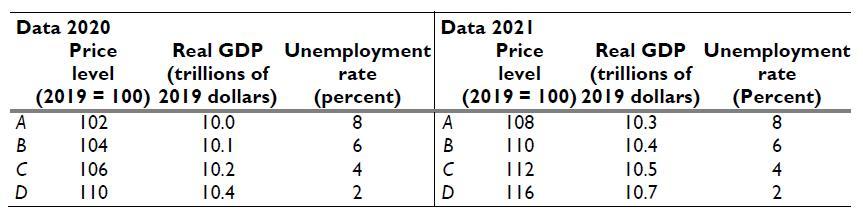
In 2020, the outcome turned out to be row D of the left side table. Plot the short-run Phillips curve for 2021 and mark the points A, B, C, and D that correspond to the data in the right part of the table.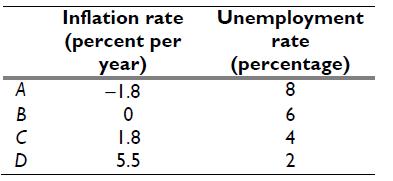
Fantastic news! We've Found the answer you've been seeking!
Step by Step Answer:
Use the table above to plot the Phillips curve The table is constructed similarly to ...View the full answer

Answered By
Nyron Beeput
I am an active educator and professional tutor with substantial experience in Biology and General Science. The past two years I have been tutoring online intensively with high school and college students. I have been teaching for four years and this experience has helped me to hone skills such as patience, dedication and flexibility. I work at the pace of my students and ensure that they understand.
My method of using real life examples that my students can relate to has helped them grasp concepts more readily. I also help students learn how to apply their knowledge and they appreciate that very much.
1+ Reviews
10+ Question Solved
Related Book For 

Question Posted:
