

The table provides data on the price of a balloon ride, the temperature, and the number of
Question:
The table provides data on the price of a balloon ride, the temperature, and the number of rides a day. Draw graphs to show the relationship between
• The price and the number of rides, when the temperature is 70°F.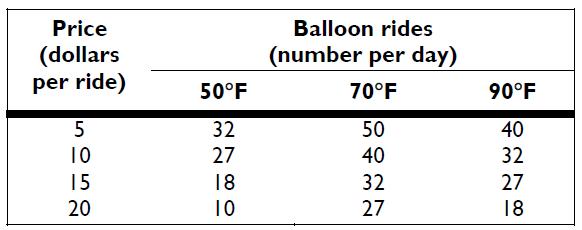
• The number of rides and the temperature, when the price is $15 a ride.
Fantastic news! We've Found the answer you've been seeking!
Step by Step Answer:
The price and the number of rides when the temperature is 70F Figure A13 illustrates the relatio...View the full answer

Answered By
Kalyan M. Ranwa
I have more than seven years of teaching experience in physics and mechanical engineering.
1+ Reviews
10+ Question Solved
Related Book For 

Question Posted:
