

Use the information in the table to work Problems. Column A is the year; the other columns
Question:
Use the information in the table to work Problems. Column A is the year; the other columns are quantities sold in millions per year of compact discs (column B), music videos (column C), and video streaming (column D).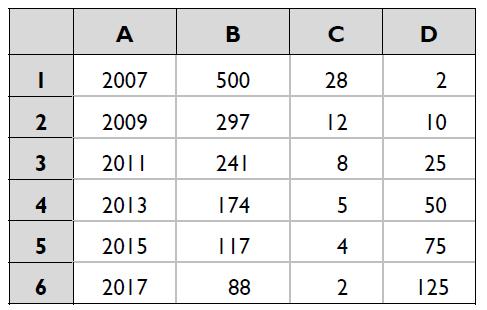
Draw a scatter diagram to show the relationship between quantities sold of music videos and video streaming. Describe the relationship.
Fantastic news! We've Found the answer you've been seeking!
Step by Step Answer:
Figure A15 illustrates the relationship of the data from the spreadsheet between the quantiti...View the full answer

Answered By
Michael Owens
I am a competent Software Engineer with sufficient experience in web applications development using the following programming languages:-
HTML5, CSS3, PHP, JAVASCRIPT, TYPESCRIPT AND SQL.
1+ Reviews
10+ Question Solved
Related Book For 

Question Posted:
