

The following are the end-of-month prices for both the Standard & Poors 500 Index and Nikes common
Question:
The following are the end-of-month prices for both the Standard & Poor’s 500 Index and Nike’s common stock. a. Using the data here, calculate the holding-period returns for each of the months.
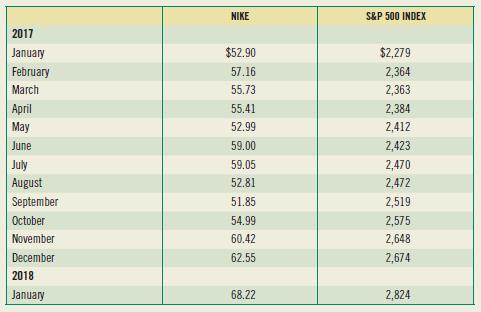
b. Calculate the average monthly return and the standard deviation for both the S&P 500 and Nike.
c. Develop a graph that shows the relationship between the Nike stock returns and the S&P 500 Index. (Show the Nike returns on the vertical axis and the S&P 500 Index returns on the horizontal axis as done in Figure 6-5.)
d. From your graph, describe the nature of the relationship between Nike stock returns and the returns for the S&P 500 Index.
Fantastic news! We've Found the answer you've been seeking!
Step by Step Answer:
a b Average monthly return 235 181 Standard deviation 672 164 c Using the Excel function Sl...View the full answer

Answered By
Kennedy Odhiambo
As a professional writer, I have been in the field for over 5 years having worked as a lecture in different tertiary institutions across the world. With this impeccable experience, I assure provision of a good and supporting environment for students to learn.
2+ Reviews
10+ Question Solved
Related Book For 
Foundations Of Finance
ISBN: 9780135160619
10th Edition
Authors: Arthur J. Keown, John H. Martin, J. William Petty
Question Posted:
