

Horizontal analysis (trend analysis) percentages for Phoenix Companys sales revenue, cost of goods sold, and expenses are
Question:
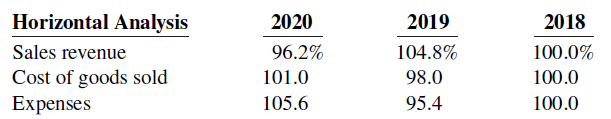
Explain whether Phoenix€™s net income increased, decreased, or remained unchanged over the 3-year period.
Fantastic news! We've Found the answer you've been seeking!
Step by Step Answer:
Comparing the percentages presented results in the following conclusions T...View the full answer

Answered By
Aun Ali
I am an Associate Member of Cost and Management Accountants of Pakistan with vast experience in the field of accounting and finance, including more than 17 years of teaching experience at university level. I have been teaching at both undergraduate and post graduate levels. My area of specialization is cost and management accounting but I have taught various subjects related to accounting and finance.
13+ Reviews
32+ Question Solved
Related Book For 

Accounting Principles
ISBN: 978-1119411482
13th edition
Authors: Jerry J. Weygandt, Paul D. Kimmel, Donald E. Kieso
Question Posted:
