

Refer to the CVP chart in QS 21-14 and solve for each of the items below. 1.
Question:
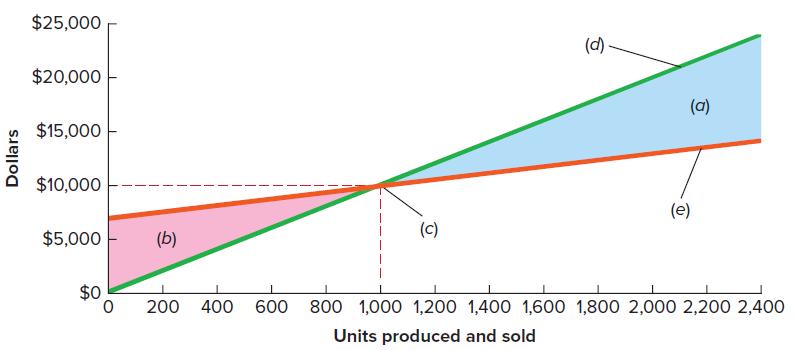
Refer to the CVP chart in QS 21-14 and solve for each of the items below.
1. Units produced at break-even point
2. Dollar sales at break-even point
3. Capacity in units
4. Are fixed costs greater than $10,000?
5. If 1,400 units are produced and sold is there a profit or a loss?
Data From QS 21-14
Match the descriptions 1 through 5 with labels a through e on the CVP chart.
1. Break-even point
2. Total sales line
3. Loss area
4. Profit area
5. Total costs line
Fantastic news! We've Found the answer you've been seeking!
Step by Step Answer:
In the given graph a represent profit area b represent loss area c ...View the full answer

Answered By
Marvine Ekina
Marvine Ekina
Dedicated and experienced Academic Tutor with a proven track record for helping students to improve their academic performance. Adept at evaluating students and creating learning plans based on their strengths and weaknesses. Bringing forth a devotion to education and helping others to achieve their academic and life goals.
PERSONAL INFORMATION
Address: , ,
Nationality:
Driving License:
Hobbies: reading
SKILLS
????? Problem Solving Skills
????? Predictive Modeling
????? Customer Service Skills
????? Creative Problem Solving Skills
????? Strong Analytical Skills
????? Project Management Skills
????? Multitasking Skills
????? Leadership Skills
????? Curriculum Development
????? Excellent Communication Skills
????? SAT Prep
????? Knowledge of Educational Philosophies
????? Informal and Formal Assessments
0 Reviews
10+ Question Solved
Related Book For 
Question Posted:
