

Question: Answer Problem 4.80 for a binomial distribution with parameters n = 10 and p = .95. Compare your results with Figure 4.5(b). Figure 4.5(b): (b)
Answer Problem 4.80 for a binomial distribution with parameters n = 10 and p = .95. Compare your results with Figure 4.5(b).
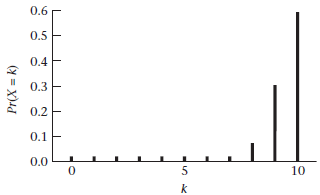
Figure 4.5(b):
(b) n = 10, p = .95
SIMULATION
An attractive feature of modern statistical packages such as MINITAB, Excel, or R is the ability to use the computer to simulate random variables on the computer and to compare the characteristics of the observed samples with the theoretical properties of the random variables.
0.6 0.5 0.4 F 0.3 E 0.2 E 0.1 0.1 F 0.0 10 (Y = X)4d
Step by Step Solution
3.44 Rating (163 Votes )
There are 3 Steps involved in it
Again this histogram has similar sh... View full answer

Get step-by-step solutions from verified subject matter experts
Document Format (2 attachments)
1427_6054778a297fe_656408.pdf
180 KBs PDF File
1427_6054778a297fe_656408.docx
120 KBs Word File