

Assess whether there are any outliers for full-scale IQ in the control group? Environmental Health, Pediatrics Refer
Question:
Environmental Health, Pediatrics
Refer to Figure 8.12 (p. 313) and Table 8.7 (p. 305).
Figure 8.12: Stem-and-leaf and box plots of full-scale IQ by group, El Paso Lead Study
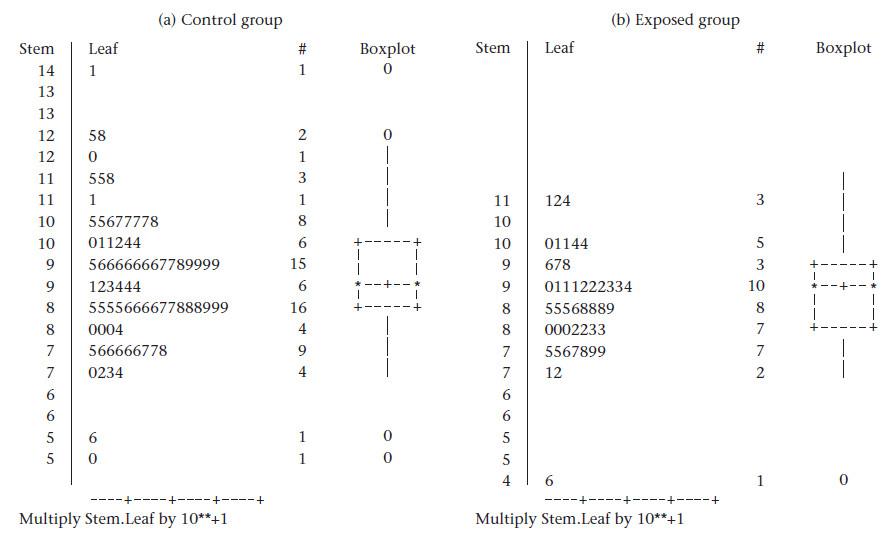
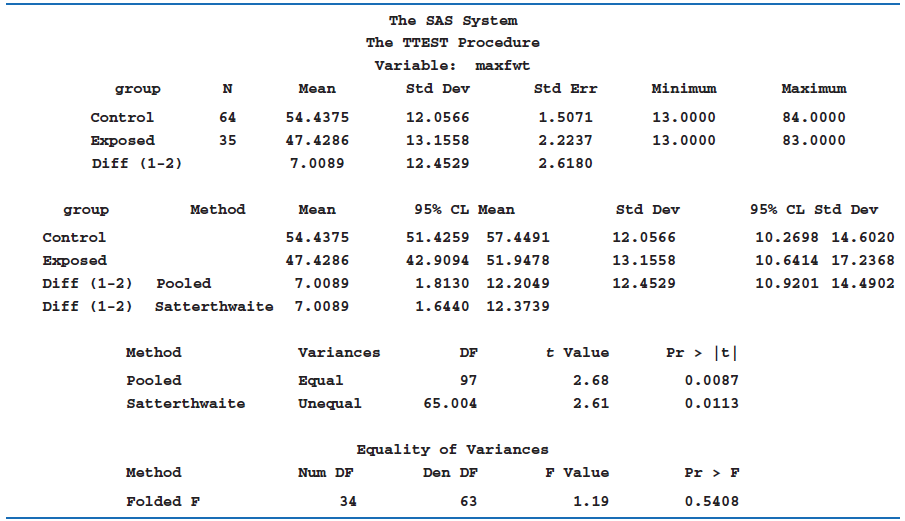
Table 8.7: Comparison of mean finger-wrist tapping scores for the exposed vs. control group using PROC TTEST of SAS
Fantastic news! We've Found the answer you've been seeking!
Step by Step Answer:
We will use the ESD Many Outlier Procedure given in Equation 829 in Chapter 8 text From Table 87 we ...View the full answer

Answered By
Sufiyan Ahmed Tariq
I am a Chartered Accountant and an Associate Public & Finance Accountant. I also hold a bachelors of Commerce degree. I have over 8 years of experience in accounting, finance and auditing. Through out my career, I have worked with many leading multinational organisation.
I have helped a number of students in studies by teaching them key concepts of subjects like accounting, finance, corporate law and auditing. I help students understanding the complex situation by providing them daily life examples.
I can help you in the following subject / areas:
a) Accounting;
b) Finance;
c) Commerce;
d) Auditing; and
e) Corporate Law.
7+ Reviews
17+ Question Solved
Related Book For 

Question Posted:
