

Fit a regression line relating age to SBP, using the data in Table 11.18? Hypertension The Update
Question:
Hypertension
The Update to the Task Force Report on Blood Pressure Control in Children [12] reported the observed 90th percentile of SBP in single years of age from age 1 to 17 based on prior studies. The data for boys of average height are given in Table 11.18.
Table 11.18: 90th percentile of SBP in boys ages 1ˆ’17 of average height
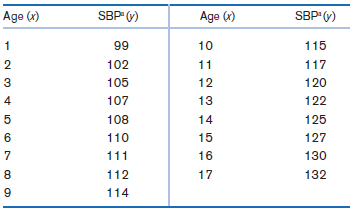
a90th percentile for each 1-year age group.
Suppose we seek a more efficient way to display the data and choose linear regression to accomplish this task.
Fantastic news! We've Found the answer you've been seeking!
Step by Step Answer:
The least squares estimate...View the full answer

Answered By
Branice Buyengo Ajevi
I have been teaching for the last 5 years which has strengthened my interaction with students of different level.
1+ Reviews
10+ Question Solved
Related Book For 
Question Posted:
