

The regression coefficient for smoking is 0.7 ± 0.1, p < .001. Does this mean that smokers
Question:
Table 11.31: FEV.DOC
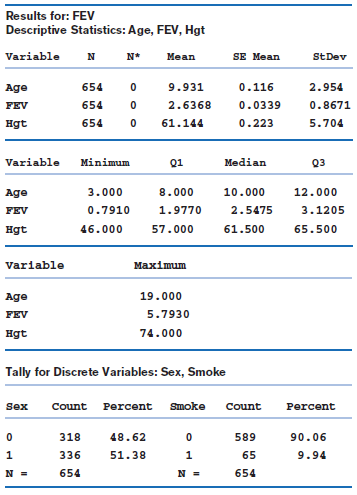
Some descriptive statistics of the variables in the data set using Minitab are given in Table 11.32.
Table 11.32: Descriptive statistics for FEV.DAT
We first ran a regression of FEV on smoking as shown in Table 11.13.
Table 11.33: Regression of FEV on smoking in FEV.DAT

Fantastic news! We've Found the answer you've been seeking!
Step by Step Answer:
This means that the smokers in this data set had ...View the full answer

Answered By
Mugdha Sisodiya
My self Mugdha Sisodiya from Chhattisgarh India. I have completed my Bachelors degree in 2015 and My Master in Commerce degree in 2016. I am having expertise in Management, Cost and Finance Accounts. Further I have completed my Chartered Accountant and working as a Professional.
Since 2012 I am providing home tutions.
2+ Reviews
10+ Question Solved
Related Book For 
Question Posted:
