

Question: Use ordinal logistic regression to assess the association between SBP z-score group and the same variables in Problem 13.122? Hypertension The data set WALES.DAT contains
Hypertension
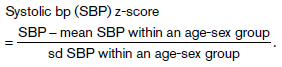
The data set WALES.DAT contains familial data on blood pressure (bp) in two-communities in South Wales (the Rhondda Fach and the Vale of Glamorgan). Subjects were seen at 4 visits from the mid 1950s to the early 1960s. For this problem we will focus on bp among adults (age ‰¥ 30) at the first visit. To standardize bp for age and sex, we will use the z-score approach within 10-year age-sex groups (i.e., age 30€“39 males/40€“49 males/50€“59 males/60+ males/30€“39 females/40€“49 females/50€“59 females/60+ females) where
We then group SBP z-score for ease of interpretation as
follows:
SBP z-score group = 2 if SBP z-score ‰¥ 1.0,
= 1 if SBP z-score ‰¥ 0.5 and < 1.0,
= 0 if SBP z-score < 0.5 and not missing
Systolic bp (SBP) z-score SBP - mean SBP within an age-sex group sd SBP within an age-sex group ||
Step by Step Solution
3.46 Rating (162 Votes )
There are 3 Steps involved in it
The ordinal logistic regression for SBP zscore group variable gives the following results The output ... View full answer

Get step-by-step solutions from verified subject matter experts