

Download the spreadsheet from the books Web site containing the data for Figure 11.1. a. Compute the
Question:
Download the spreadsheet from the book’s Web site containing the data for Figure 11.1.
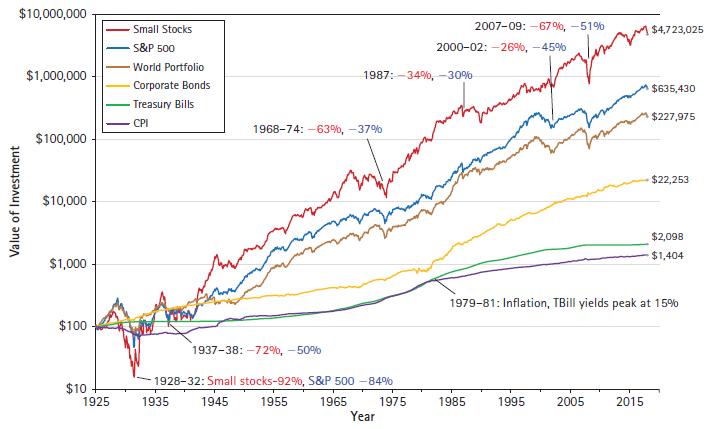
a. Compute the average return for each of the assets from 1929 to 1940 (the Great Depression).
b. Compute the variance and standard deviation for each of the assets from 1929 to 1940.
c. Which asset was riskiest during the Great Depression? How does that fit with your intuition?
Fantastic news! We've Found the answer you've been seeking!
Step by Step Answer:

Answered By
PALASH JHANWAR
I am a Chartered Accountant with AIR 45 in CA - IPCC. I am a Merit Holder ( B.Com ). The following is my educational details.
PLEASE ACCESS MY RESUME FROM THE FOLLOWING LINK: https://drive.google.com/file/d/1hYR1uch-ff6MRC_cDB07K6VqY9kQ3SFL/view?usp=sharing
3+ Reviews
10+ Question Solved
Related Book For 

Fundamentals Of Corporate Finance
ISBN: 9780135811603
5th Edition
Authors: Jonathan Berk, Peter DeMarzo, Jarrad Harford
Question Posted:
