

If we constructed a chart like Figure 2.2 for a typical S&P 500 stock, do you think
Question:
If we constructed a chart like Figure 2.2 for a typical S&P 500 stock, do you think it would show more or less volatility? Explain.
Figure 2.2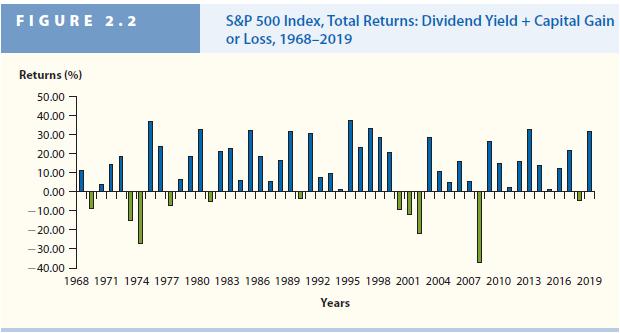
Fantastic news! We've Found the answer you've been seeking!
Step by Step Answer:

Answered By
Seema kuldeep
although I don't have an experience of teaching in a particular institute, previously I was an expert on Chegg and I have used to teach my batch mates and also my juniors.
1+ Reviews
10+ Question Solved
Related Book For 

Fundamentals Of Financial Management
ISBN: 9780357517574
16th Edition
Authors: Eugene F. Brigham, Joel F. Houston
Question Posted:
