

Which of the two stocks graphed in Figure 8.3 is less risky? Why? Identify the three measures
Question:
Which of the two stocks graphed in Figure 8.3 is less risky? Why? Identify the three measures of stand-alone risk discussed in this section. Briefly explain what each measure indicates.
Figure 8.3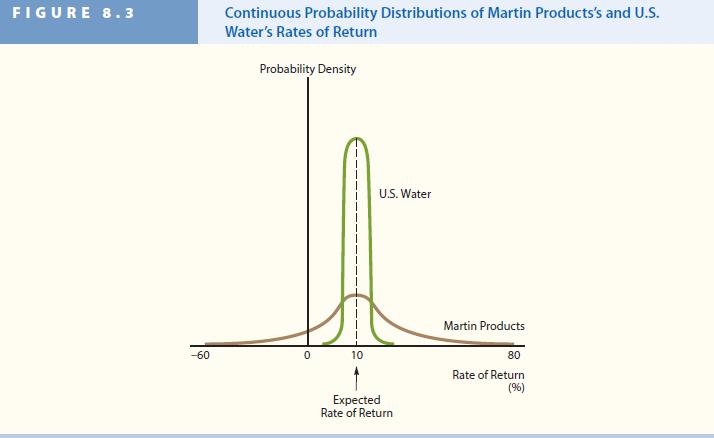
Fantastic news! We've Found the answer you've been seeking!
Step by Step Answer:

Answered By
Michael Owens
I am a competent Software Engineer with sufficient experience in web applications development using the following programming languages:-
HTML5, CSS3, PHP, JAVASCRIPT, TYPESCRIPT AND SQL.
1+ Reviews
10+ Question Solved
Related Book For 

Fundamentals Of Financial Management
ISBN: 9780357517574
16th Edition
Authors: Eugene F. Brigham, Joel F. Houston
Question Posted:
