

The following table shows key financial data for three companies in the automobile manufacturing industry: Toyota, Nissan,
Question:
The following table shows key financial data for three companies in the automobile manufacturing industry: Toyota, Nissan, and Honda. All values are in millions of yen.
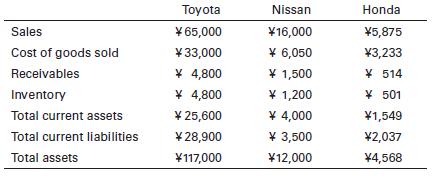
a. Calculate each of the following ratios for all three companies: current ratio, net working capital, inventory turnover, average collection period, and total asset turnover.
b. Which company has the greatest liquidity?
c. Would you say that the three perform similarly or differently in terms of collecting receivables? Why do you think that might be?
d. Which company has the most rapid inventory turnover? Which company appears to be least efficient in terms of total asset turnover? Are your answers to those questions a little surprising? If a company is best at inventory turnover and worst at total asset turnover, what do you think that means?
Step by Step Answer:
Answer a Toyota Current Ratio Current Assets Current Liabilities 280000 150000 187 Net Working Capit...View the full answer


Fundamentals Of Investing
ISBN: 9780135175217
14th Edition
Authors: Scott B. Smart, Lawrence J. Gitman, Michael D. Joehnk
